4 Curriculum management, improving learner performance and the rise of multi-grade classes: A tangled web of challenges to the design, operation and evaluation of educational development programmes in South Africa
Author and publication details
Eric Schollar, Eric Schollar and Associates (ESA), eric.esa@gmail.com
Published in: Christie, P. & Monyokolo, M. (Eds). (2018). Learning about sustainable change in education in South Africa: the Jika iMfundo campaign 2015-2017. Saide: Johannesburg.
Download PDFIntroduction
The seemingly endemic persistence of very poor outcomes of the education system, despite the allocation and rationalisation of an increasing level of national investment, continues to be a significant obstacle to personal, social and economic development in South Africa.
In seeking to improve these outcomes – to improve learner performance on a national scale – one of the central responses of National and Provincial Departments of Education has been to pay an increasing level of attention to improving curriculum management and coverage. Equally, independent development foundations and non-governmental organisations, typically operating in conjunction with departments of education, have increasingly adopted improved curriculum management as an essential component and outcome objective of their developmental initiatives.
The Programme for Improving Learning Outcomes (PILO), currently operating in KwaZulu-Natal (KZN) as a constituent part of the National Education Collaboration Trust (NECT), is a significant example. PILO proposes that improving curriculum management and coverage in terms of both quantity and quality across whole districts through a collaborative and systemic approach will result in improvements in learner performance on an equally large scale. The “means” and “ends” logic of PILO’s causative proposition is both simple and clear: the greater the degree to which learners are exposed to the intended curriculum, the more likely they will obtain improved performance scores on instruments that assume they have covered the whole of the curriculum.
This chapter takes, as its starting point, agreement with the fundamental logic of the PILO model and its causative proposition. It concludes by identifying a critical confounding variable that has a substantial effect on the likelihood of learners’ achievement of significant performance which is extrinsic to the inherent value of the PILO programme, or of any other programmes that share a focus on curriculum management as their key “lever of change”. This variable refers to the rise, on a national scale, of the heterogeneous distribution of learner competencies within and across grade levels that currently predict the age cohort of learners rather than their expected attained competency levels. In effect, the great majority of classes, at all grade levels, have become multi-grade classes in which it is very difficult, if not impossible, for teachers to consistently teach and assess learners at the correct complexity level for the whole of the curriculum. This situation, in the final analysis, is an unintended outcome of national assessment policy rather than district, school or teacher level dysfunction of one kind or another.
A consequence of classrooms being, in effect, multi-grade is that it is likely that improvements in curriculum management, essential as they are, will suffer from a “ceiling effect” in achieving improvements in learner performance as learners reach the limits of their attained “schooled capacity”. Learners at, for example, a Grade 5 or 6 level of content competence in mathematics will inevitably find it insuperably difficult to benefit from instruction pitched at Grade 9 level without extensive and sustained remediation.
Programme impact evaluation studies run the risk of generating a false negative with regard to a strategic model if they do not take this “confounding” variable into account when collecting and interpreting obtained performance scores. A genuinely effective treatment programme that improves curriculum management may nonetheless fail to obtain significant impacts because of the countervailing effect of this variable.
We note here that, as long as English is used as the Language of Learning and Teaching in the huge majority of South African schools and universities, the ability to comprehend, speak, read and write this language is obviously a very powerful influence indeed on the learning of any subject. It is a necessary, but not sufficient, condition for the development of competence in any subject. That it is not a sufficient explanation for poor learner performance is logically demonstrated by the fact that strongly literate people, whose home language is English, are not necessarily also high performers in other subjects, especially mathematics and science. For this reason and for the sake of both convenience and brevity, this chapter largely confines itself to data and discussion around mathematics which is used as a critical proxy for all subjects taught in English.
Poor outcomes of the education system
Improvement in the quality of the outcomes of the South African education system is regarded as a critical component of national development. Actual real expenditure on education has continued to grow since the watershed year of 1994 and, as Van der Berg (2007, p. 871) points out, South Africa’s “public education spending ratio of 6% of GDP is high by world standards”. South Africa spent R213.7bn on basic education in the 12 months ended March 2016, or about 15% of the total budget and the allocation is projected to rise at an average of 7.4% annually over the next three fiscal years, according to the National Treasury.1
Fiscal redistribution after the transition from apartheid has resulted in significant transfers of resources to historically disadvantaged sectors. A number of significant policy changes have been introduced into the general system ranging from the establishment of equitable funding and provisioning norms for schools through the National Norms and Standards for School Funding policy, to the rationalising of teacher supply through “right-sizing” and, crucially, the introduction of the new OBE curriculum in 1998 (Curriculum 2005), along with its subsequent iterations in the form of the National Curriculum Statement (NCS), the Foundations for Learning Campaign (FFLC) and the Curriculum Assessment Policy Statements (CAPS).
Until the first report of the National Systemic Evaluation (NSE) on the outcomes of the primary sector was available (DoE, 2003), we had only one standardised indicator for the effects of these increased inputs and policy changes on the outcomes of the education system in the form of the matriculation examinations at the end of Grade 12. In short, outcome measurement for both primary and secondary sectors demonstrates that the persistence of near endemic underperformance in mathematics and science, in particular, has proven exceptionally difficult to ameliorate.
The results of the matriculation examinations are the most public reflection of the performance of the system and are surrounded by a great deal of popular, political, practitioner and academic debate. Even if different actors have different perspectives on whether results are improving or not, they all continue to agree that learner performance in English, mathematics and science, in particular, continue to lag far behind the expectations of our own curriculum.
To provide another perspective on the concept of performance at matriculation level and to “control” for systemic and operational dysfunctions which tend to obscure the intrinsic educational effect of the intended curriculum, it is valuable to look at the performance of schools that are highly educationally functional. To obtain data of this sort, Mouton and Schollar (2014) analysed performance between 2008 and 2012 in the matriculation mathematics examination by learners from 159 high-performing public state schools in all nine provinces. These schools are representative of the schools that produce the overwhelming majority of all matriculation passes for all races outside of the independent school sector (Van der Berg, 2007).2
To generate this sample of schools, the researchers used information from the Mathematics Challenge Programme (MCP) which targeted the highest performing state schools. A list of these schools, based on data provided by the DBE, was compiled and schools included on the list were invited to apply for self-designed support from the MCP. The list was not based only on absolute scores obtained by learners; selection also placed an emphasis on black schools from either former homeland Departments of Education or the pre-1994 Department of Education and Training (DET) that had, despite significant odds, managed to perform well above average in terms of both quantity and quality of matriculation passes in mathematics. These schools have demonstrated an ability to process input resources more efficiently than many other schools, despite sharing historical differences with them and, therefore, it was assumed that investments in these schools could be expected to improve the quality of their outputs further.
The eventual invitation list of 159 schools for the initial year (2008) constituted four broad categories of schools:
- Top-performing black schools based on scores alone (45 schools)
- Black schools that increased participation (22 schools)
- Schools catering historically to white learners that were demonstrably transforming in racial terms. This included some of the best known and highest performing of the ex-Model C schools (38 schools)
- Schools catering historically to Indian and coloured learners (54 schools).
In terms of a performance baseline for inclusion, all the schools invited had, in previous years, produced 20 or more Indian, coloured and black African higher grade maths candidates and were schools in which either two-thirds of these learners passed maths at higher grade, or had 20 or more learners with higher grade maths passes.
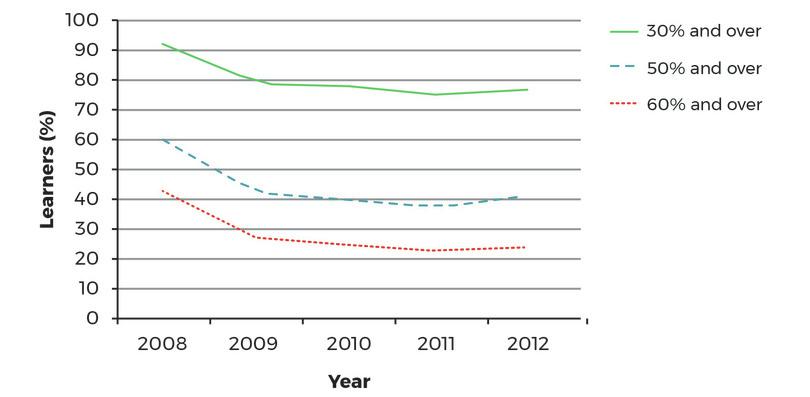
Proportion of mathematics matriculation learners obtaining scores at different levels of quality in high-performing public schools: 2008–2012
Figure 4.1 Proportion of mathematics matriculation learners obtaining scores at different levels of quality in high-performing public schools: 2008–2012
These figures were matched by similar declines for each of the four racial groups that were not caused by demographic changes. Additionally, the great majority of learners at these schools had completed most, if not necessarily all, of their secondary schooling prior to Grade 12 at the same school; declines were therefore not caused by learner mobility.
It is evident that, even in the best performing schools, learner performance is not improving but has actually worsened since 2008 especially at the higher levels of quality. Just under one quarter of all learners at the best performing mathematics schools in the country do not achieve even the current pass mark of 30% and less than one quarter is capable of achieving a high-quality pass mark of 60%.
The study clearly confirmed that these schools were atypical of the great majority of state schools. They are educationally functional schools with much more effective school and curriculum management systems, higher levels of teacher professionalism, provide many more weeks of instruction over a year, provide learners with vastly more opportunities to learn,3 and cover more of the curriculum. These conditions very clearly do explain why learners in these schools perform very much better than learners in the rest of the South African school system but they cannot also explain why performance in these schools is, nevertheless, declining. In fact, the opposite should be true if the by now conventional reasons, based on educational functionality, provided a comprehensive and sufficient explanation for underperformance over time. Clearly, they do not do so.
The NSE (mentioned earlier) has provided invaluable and reliable early data on a national scale about what has been happening to performance levels at other levels of the system through instruments standardised against the Assessment Standards of the National Curriculum Statement to track learner achievement at Grade 3 and 6 levels.4 The first cycle of testing for the NSE was conducted at Foundation Phase level (Grade 3) in 2000 (Department of Education, 2003), while the second cycle was conducted at Intermediate Phase level (Grade 6) in 2005 (Department of Education, 2005). Both cycles concluded that the majority of learners were performing very poorly in numeracy and mathematics; the national mean score of the Grade 3 group was 30% and that of Grade 6 was 27%.
In the 2005 cycle, learner performance at Grade 6 level in mathematics was also reported against a four-point assessment scale. The conclusion was that an astonishing 80% of all learners were performing below the minimum expected competence level (“partly achieved”) for that grade (see Table 4.1).
| Test score range | % of learners | |
|---|---|---|
| Not achieved | 1–39 | 81 |
| Partly achieved | 40–49 | 7 |
| Achieved | 50–69 | 8 |
| Outstanding | 70–100 | 4 |
| Total | 100 |
NSE: Grade 6 mathematics learners at different achievement levels of NCS (%)
Table 4.1 NSE: Grade 6 mathematics learners at different achievement levels of NCS (%)
South Africa has, in addition, participated in a number of large-scale international comparative studies that seek to benchmark academic performance across groups of countries:
- Monitoring Learner Achievement Study (MLA) (Chinapah et al., 2000)
- Southern and East African Consortium for Monitoring Educational Quality (SACMEQ) (Moloi & Strauss, 2005)5
- Trends in Mathematics and Science Study (TIMSS) (Howie, 2000; Mullis, Martin, Gonzalez, & Chrostowski, 2004).
It is evident that these studies all provided data that are not recent; both SACMEQ and TIMSS have since completed further assessments. Their results do show some changes with regard to South African performance levels but they are not sufficiently significant to challenge the fundamental conclusions drawn from the earlier studies. The substantive point, in terms of the argument of this paper, is that the conditions I sketch have their origins a long time ago – this is no transient problem that can be expected to disappear over a few years. In fact, later evidence, especially from the ANA but also from ongoing educational and evaluation research, continues to support these conclusions; the conditions to which I refer have a consistent and sustained evidence base over more than a decade.
In short, it has become increasingly evident over the last one and a half decades that the performance of the majority of South African school learners lags far behind the expectations of our own curriculum. In addition, all three of the early comparative studies (MLA, SACMEQ and TIMSS) demonstrated that South African learners were achieving performance levels well below those of their counterparts in both Africa and the rest of the world.
The MLA was carried out in 12 African countries in 2000 and tested samples of Grade 4 learners in 400 schools in all nine provinces of South Africa. These learners performed poorly when compared with their counterparts in the rest of Africa, obtaining a mean of 30% compared with the mean of 47% in the other 11 countries. Over 40% of learners obtained a score of below 25% and almost 90% scored below 50% (see Table 4.2).
| Range | Proportion of sample |
|---|---|
| 0 to 24 | 43.9 |
| 25 to 49 | 45.8 |
| 50 to 74 | 8.8 |
| 75 to 100 | 1.5 |
| 100 |
Mathematics score ranges of South African sample: MLA (%)
Table 4.2 Mathematics score ranges of South African sample: MLA (%)
SACMEQ monitors the quality of education in 15 African countries. This chapter uses data from two assessments that were undertaken at the Grade 6 level. The first was in 2000 in which the South African sample consisted of learners selected from 169 schools in all nine provinces. The second assessment in 2007 greatly increased the scale with a sample from 392 schools. This study introduced a shift away from the conventional method of measuring learner achievement in terms of mean scores, instead also used the RASCH model (Andrich & Douglas, 1982) to measure learners against statistically expected levels of performance on a hierarchy of eight levels of competency from the simple to the complex. The method allows reliable comparisons of levels of achievement against an objective scale across different contexts, countries and schools. The equivalent South African grade levels for the SACMEQ competency levels, as shown in Table 4.3, were described by the then-Director of the NSE (Moloi, 2006).
| SACMEQ level | SACMEQ Description | NCS Grade level |
|---|---|---|
| VIII | Abstract problem solving | ++7 |
| VII | Concrete problem solving | +7 |
| VI | Mathematically skilled | 7 |
| V | Competent numeracy | 6 |
| IV | Beginning numeracy | 5 |
| III | Basic numeracy | 4 |
| II | Emergent numeracy | 3 |
| I | Pre numeracy | 2 and below |
Comparison of SACMEQ competency levels and NCS grade levels
Table 4.3 Comparison of SACMEQ competency levels and NCS grade levels
The report on the 2000 assessments showed that 85% of South African learners in Grade 6 reached only the lower four levels of competency in mathematics on the SACMEQ continuum and that 52% of them were achieving scores at the Grade 3 competency level or lower (Moloi & Strauss, 2005). The figures obtained in 2007 showed that this condition persisted over the intervening seven years (Figure 4.2).

Grade 6: Distribution of scores by SACMEQ competency levels – 2000 and 2007
Figure 4.2 Grade 6: Distribution of scores by SACMEQ competency levels – 2000 and 2007
There was some improvement in the lower proportion of the learners who were achieving scores at Grade 3 level or lower (SACMEQ competency levels 1 and 2) in 2007. This is certainly encouraging but rather more significant for this analysis is that the means in both studies cluster around competency level 2 – emergent numeracy – and that over 80% of learners in Grade 6 obtained scores in the lower four levels of competency (i.e. were below the minimum expected standard for that grade) in both cycles.
TIMSS, like SACMEQ, also provides information on benchmarked distributions in learner data and the proportion of learners who did not meet the minimum expected competence levels in mathematics for their grade levels. The figures obtained by both studies were strikingly similar to those obtained in the NSE (see Table 4.4).6
| NSE | SACMEQ | TIMSS | |
|---|---|---|---|
| Grade 6: 2005 | Grade 6: 2000 | Grade 6: 2007 | Grade 8: 2003 |
| 81 | 85 | 85 | 82 |
Proportion of learners who did not achieve minimum expected standards (%)
Table 4.4 Proportion of learners who did not achieve minimum expected standards (%)
The fact that the same figure was obtained by three different studies, using four different instruments administered to four different national samples, in four different years from 2000 to 2007 and at two different grade levels, greatly increases the reliability of the evidence for the conclusion that around 80% of learners in primary schools are below the minimum expected competency level for the grades in which they are enrolled.
The most recently available national performance figures from different levels of the system, both primary and secondary, are derived from the Annual National Assessments (ANA). A number of cogent arguments have been raised with regard to the reliability of trend measurement using ANA data collected through test instruments that are not capable of yielding reliable comparative information from one year to the next. Nonetheless, the ANA data are the only available information we have about national performance at different levels of the system from year to year and are of immense potential value. Irrespective of the longitudinal reliability of each instrument, the data for each year are still of real interest. Scale alone helps to control, to some degree, random variations in teacher attitudes and behaviour during testing and scoring though we can safely assume that the “error tendency” will be to inflate the scores.
A recent review of the ANA data by Simkins (2013) provides grade-by-grade detail to the finding based on the NSE, SACMEQ and TIMSS studies (see Figure 4.3).

Mean learner mathematics score: ANA, 2012
Figure 4.3 Mean learner mathematics score: ANA, 2012
Adapted from Simkins (2013, p. 12).
Learner mean scores decline precipitously from Grade 1 onwards and, by Grade 3, the figure is already well below what can reasonably be regarded as a conventional or realistic “pass mark” of 50%. By Grade 6, the mean has dropped below even the currently applicable pass mark of 30% and the national mean for Grade 9 was, astonishingly, just over 10%!
Simkins provides a particularly depressing analysis of performance in mathematics at Grade 9 level by showing that a staggering 92% of learners obtained scores of under 30% in 2012 with only 2% obtaining a score of 50% or higher! Given an enrolment in Grade 9 of 1 096 113 in 2012, this means that only about 47 000 learners obtained a score of 30% or higher and about 24 000 a score of 50% or higher (Simkins, 2013, p. 12). He concludes that the necessary implication is that most learners do not learn all of the required content specified by the intended curriculum each year. “Gaps accumulate and progressively undermine performance” (Simkins, 2013, p. 2).
Spaull is even more explicit about the educational consequences of this rapid decline in actual competence level against curriculum expectations at primary level on, eventually, the outcomes of the matriculation mathematics examinations:
The learning deficits that children acquire in their primary school career grow over time to the extent that they become insurmountable and preclude pupils from following the curriculum at higher grades, especially in subjects that are vertically demarcated like mathematics and science (2013, p. 8).7
These are all startling findings that imply a virtual collapse of organised grade/standards-based mathematical education and assessment in this country. In terms of the argument of this paper, we have established the evidence for concluding that around 80% of South African learners are below the minimum expected competency level for the grades in which they are currently enrolled. The obvious implication is that because learners from multiple grade competency levels are enrolled in the same classes, the majority of classes have, in effect, become multi-grade.
Causes of poor learner performance
The problem of underperformance in mathematics – or, indeed, in other subjects like English and science – has not, of course, gone unnoticed since 1998. This is not the place to provide a systematic review of the voluminous literature on this topic but it is necessary to place the concept of curriculum management as a response to poor performance in its historical context.
An early synthesis of research findings by Taylor and Vinjevold (1999) note factors like poor school management, a low work ethic among many learners and teachers and the poor conceptual knowledge of teachers of the subjects they are teaching. Along with these factors, the abolition of a prescriptive syllabus of study, along with standard textbooks, in favour of underspecified work programmes for teachers and the use of a wide variety of learning materials received mention, as did a poor understanding and use of learner-centred methodologies by teachers.
Christie and Potterton (1999) suggest, inter alia, that the development of the capacity of Principals to provide school leadership was critical. Regular and extensive disruption to schooling and the persistence of educational dysfunction in many schools has remained a significant concern since pre-1994. Jansen (2013) examines the nature and social history of the different forms of the culture of learning in schools and how they influence both teaching and learning. Sectors of the national system still vary in their ethos of schooling which produces different levels of quality of outcomes in different schools.
Taylor, Muller and Vinjevold (2003) provide an extensive meta-review of a number of programme evaluation studies that clearly support the conclusion that learners were gaining little from the introduction of the new curriculum. Fleisch (2007) provides an extensive review of existing research on learner performance and casts his net of explanation/causation widely to include a range of social and economic factors (health, nutrition and widespread disease, poverty, child labour, change in family structures and home support, expenditure and resources), as well as school-based ones such as the language of learning and teaching, textbooks and the pacing, coverage and sequencing of the curriculum, teaching methods and the teachers’ grasp of subject content.
In one way or another, all of the causative explanations for poor learner performance, singly or in combination, suggested in these meta-reviews, are intuitively plausible per se. Hungry or sick learners are unlikely to perform well. The culture of learning in schools is manifestly a significant factor in planning and sustaining systematic instructional programmes. A poor work ethic on the part of teachers will clearly influence learner performance negatively. Socio-economic status is undoubtedly related to performance to some degree. Poor teacher content knowledge cannot but be a barrier to effective instruction. A chaotic management system is unlikely to maximise time-on-task. And so on.
The multiplicity of explanations and the fact that many are “sub-sets” of others, while some refer to the macro systemic level, some to the meso community/school level and others to the micro classroom level, makes it next to impossible to design or “discover” a causal model encompassing all of them. Therefore, we are necessarily forced to be selective in designing research programmes and theoretical models that seek to establish significant empirical linkages between causation and learner performance.
In terms of empirical work toward the development of comprehensive theories explaining underperformance, there is an increasing number of high-quality studies working within the econometric production function school (Van der Berg, 2007; Gustafsson & Mabogoane, 2010). These studies seek to define or discover a model which explains a sufficient degree of variance in learner performance to produce a significant increase in the efficiency of the systemic relationship between inputs and outputs. This is a relatively new development in educational research in South Africa where quantitative, experimental and econometric work has come late to the field and qualitative non-experimental work largely dominated research before and after the turn of the century (Seekings, 2001).
Much of the early research work was necessarily concerned with structural and contextual input variables when seeking causal explanations for performance on large (national) scales. Crouch and Vinjevold (2006), for example, note that many other countries, besides South Africa, have experienced large increases in access to schooling in pursuit of equity. They conclude that the low performance levels of the country are not explainable in terms of an unduly fast expansion of schooling. Van der Berg (2007) shows that relatively high levels of expenditure, both in absolute per capita terms and in terms of the proportion of the GDP allocated to education or even the provision of relatively well-trained teachers, do not have simple linear relationships with performance. The effect of input resources was seen by Van der Berg (2007) and Seekings (2001) as being conditional on the efficiency of the conversion of input resources into educational outcomes.
Gustafsson and Mabogoane (2010), in their wide-ranging review of the economics of education literature, refer to a growing realisation that improving learner performance is a rather more serious and elusive problem than was generally assumed. Their review shows that measures of poverty, resource provision, race, class sizes and teacher supply still left some 30% of the variation in the performance of South African schools unexplained. In terms of reducing existing residuals in explaining learner performance, Gustafsson and Mabogoane (2010) note that some early production function research (including Crouch & Mabogoane, 1998) argues that there was a need to develop more reliable and usable variables on school and curriculum management and on teacher quality, “before we could explain the residual, or unexplained, part of South African production functions” (Gustafsson & Mabogoane, 2010, p. 14).
Curriculum management and coverage
As one of the “missing” variables to which Gustafsson and Mabogoane (2010) refer in explaining variances in learner performance, curriculum coverage has a strong intuitive and logical relationship with learner performance. As we have already noted, incomplete curriculum coverage inevitably has an effect when learners are tested on instruments that assume they have covered the whole curriculum. Furthermore, this factor is likely to have a cumulative and accelerating effect, especially in mathematics and science.
In the years since 2000, the issue has received increasing attention from programme evaluation researchers many of whom were associated with JET Education Services.8 Roberts’s (2005) study in Uitenhage, for example, found that, by October, there was written evidence in learners’ books that teachers had only covered 40% of the topics listed in the National Curriculum Statement. Taylor and Moyana (2005) show that, by October, 44% of Grade 3 teachers in their study had covered 25% to 50% of topics for the grade while another 39% had covered between half and three-quarters of the curriculum.
Taylor, Muller and Vinjevold (2003) note the incompleteness and slow pace of curriculum coverage in classrooms and acknowledge that learners tend to fall further behind with each grade. Furthermore, Roberts (2005, 2006) and Taylor and Moyana (2005) find that a high proportion of lessons were not offered at the correct grade level in terms of curriculum content. Roberts and Schollar (2006) show that only 32% of Grade 3 lessons were pitched at that level, while Taylor and Moyane (2006) find that only 10% of language and 21% of mathematics lessons were at the correct grade level. Several of the lessons that these researchers observed were pitched two grade levels below that which was expected. Taylor, Muller and Vinjevold (2003, p. 105) comment that “… a very low level of cognitive demand as a matter of routine [is] likely to reinforce the effects of poor planning and pacing … in systematically depriving … children of the learning experiences intended by the curriculum.”
In analytical terms, the variable coverage is extrinsic to the inherent educational quality of a given curriculum or a particular intervention programme although it logically strongly influences the magnitude of curriculum or intervention effect. Deaton (2010, p. 425), using the analysis on the macro level of the extent to which foreign aid increases economic growth as an example, refers to this sort of problem as “… the familiar problem of simultaneous causality; the effect of aid on growth, if any, will be disguised by effects running in the opposite direction … [like] … poor economic performance …”. To paraphrase Deaton and apply this to education: the inherent potential effects of a curriculum or intervention programme on the improvement of learner performance will be disguised by effects running in the opposite direction … like incomplete curriculum coverage.
The DBE and all nine of the Provincial Departments of Education have recognised the critical role played by curriculum management and have made significant efforts to improve the consistency and quality of this management, chiefly in the form of the provision of common work schedules and the formal institutional monitoring of these schedules by both School Management Teams (SMTs) and by departmental officials. Perhaps, most significantly, the CAPS programme places great weight on the sequencing, pacing and content to be provided to learners within the school year. It will also be noted that the National Education Evaluation and Development Unit (NEEDU) of the DBE decided very early that curriculum delivery should constitute the primary object of their investigations into understanding and improving the outcomes of the national education system.9
Along with state-based institutions, significant independent development agencies, for example, the Zenex Foundation, have laid an increasing stress on the improvement of educational functionality in general and on curriculum management in particular, in designing and selecting programmes to receive support. As far as other current large scale agencies are concerned, the National Education Collaboration Trust (NECT),10 a collaborative state-private sector initiative, has placed curriculum management at the centre of their developmental programme introducing, inter alia, tools designed to systematically monitor and track the planned versus actual delivery of the curriculum at a pace sufficient to cover all of it.
As we noted at the outset, the programme operated by PILO is strongly focused on the improvement of curriculum management and coverage as the key “lever of change” employed to improve learner performance on large scales. This has been a wholly appropriate strategic choice that is based on extensive educational research and experience and is directly aligned with and supportive of current educational policy and practice in South Africa.
There is, consequently, a strong logical and intuitive basis for assuming that significant improvements in curriculum management are very likely to result in significant improvements in learner performance – more learners would cover more of the curriculum each year. Since these improvements in management are, at least theoretically, achievable on large scales through the increasing degree of standardisation produced by common, paced and monitored work schedules, especially through CAPS, it appears that the goal of significant improvements in learner performance on a national scale at all levels of the education system may perhaps not be as distant as we feared.
Obstacles to qualitative improvements in curriculum management
In practice, the improvement of curriculum management and coverage has proved somewhat more complex than simply developing common work programmes and insisting that schools and teachers adhere to them. In recent years, and in a number of field research studies, officials, practitioners and researchers have become increasingly aware that apparent and reported improvements in the coverage of the curriculum do not necessarily result in substantive improvements measured through empirical indicators. The most common example of this disjunction is the comparison of reported degrees of curriculum coverage with the written work actually completed by learners.
The most recent data to which the author has access are derived from the longitudinal evaluation of a large-scale current multi-province intervention programme. Since the author is involved in the evaluation and since the most current report is not yet in the public domain, only a brief summary is provided and the intervention is not identified. By the end of 2016, just over 80% of Principals in participating schools in four provinces reported that their teachers were up-to-date with common work programmes and the overwhelming majority of HoDs reported that curriculum plans were consistently monitored. An analysis of learner workbooks, on the other hand, found no supporting evidence for these reports.
Before presenting this data, some mention of a perceived tension between quantity of coverage (how many pages were completed?) and quality of coverage (how well was it presented?), is necessary. In short, we argue that improvement in quantity is a necessary, if not sufficient, precondition for improvement in quality. In fact, it is likely that improvements in quantity, as an objective and readily researched indicator of improved curriculum management, will show a great deal of multi-collinearity with improvements in quality. This is not to imply that indicators focused specifically on quality are of no value or educational interest, but when they have been used by the author in the course of programme evaluation research, they have clearly not contradicted the conclusions based on the (more easily collected) data about quantity.
In terms of neurocognitive science, the consistent practice of newly learned information is central to the transfer of this information from short-term to long-term memory (learning). Without consistent and extensive practice, it is difficult, if not impossible, to develop the fluency, automaticity and accuracy that is the basis of conceptual and cognitive competence and creativity in any subject and, especially, in language, mathematics and science.11
Returning to the study under discussion, by the time data were collected for this study – from 660 learner workbooks in 115 schools in four provinces – there had been 31 weeks of schooling between January and September with six public holidays during school term time. Therefore, there had been a maximum possible total of 149 days of schooling during which classroom instruction could have been provided and written work could have been completed. The assumption is that one page reflects, at least, one day of schooling. This is a conservative assumption – if learners produced, for example, three pages of work in one day, we count three days of work and it is possible that the figures of pages per day provided in Table 4.5 are, if anything, actually overstated.
| Pages | Pages/day | |
|---|---|---|
| EFAL Grade 3 | 49.6 | 0.3 |
| EFAL Grade 4 | 51.5 | 0.3 |
| EFAL Grade 9 | 31.5 | 0.2 |
| Maths Grade 3 | 73.0 | 0.5 |
| Maths Grade 4 | 85.3 | 0.6 |
| Maths Grade 9 | 89.9 | 0.6 |
| Science Grade 9 | 26.0 | 0.2 |
Mean total number of pages completed per learner by the end of September and the mean number of pages per learner completed per day over 149 days (n)
Table 4.5 Mean total number of pages completed per learner by the end of September and the mean number of pages per learner completed per day over 149 days (n)
Source: Author
It is very difficult indeed to believe that any of these learners are covering the curriculum to any significant degree of quality. To take one of the most extreme examples and to use an example that is not based on mathematics, learners in EFAL in Grade 9 completed only 31.5 pages of written work.
The CAPS statement dealing specifically with writing for this grade states that
[f]requent writing practice across a variety of contexts, tasks and subjects enables learners to communicate functionally and creatively … [and] … produces competent, versatile writers who will be able to use their skills to develop and present appropriate written, visual and multi-media texts for a variety of purposes. … Learners … are expected to write particular text types independently. They will also employ the writing process to produce well organised, grammatically correct writing texts. … Good writing is a skill that needs to be developed and supported. Although reading is an important source of input, it is only through writing, that writing skills are developed.
The CAPS statement goes on to list the kinds of written texts that learners are required to produce. Drafting and editing narrative, descriptive, argumentative, discursive, reflective and expository essays, along with official formal and friendly informal letters, agenda, minutes, speeches, interviews, giving instructions, formal and formal reports, develop advertisements, give directions, write an obituary, write a CV, write a diary – and so on.
It is plainly absurd to argue that just this one section of the EFAL curriculum could be covered effectively in a total of 31.5 pages of written practice.
Part of the discrepancy between reported coverage and analysis of learner workbooks is very likely indeed to be caused by the practice of compliance with formal curriculum management requirements, for example, providing one or two exercises on a curriculum topic, recording that topic as “covered” and moving immediately onto the next topic. Also likely is the practice, recently observed by Schollar (2016), of starting each term of CAPS reporting on Week One of each term, irrespective of which week had been reached in the previous term. This seriously overstates the degree of coverage reported to departmental officials and intervention programme staff by discarding the incomplete sections of the previous term’s content. By the end of the year, it is possible for a school to be 12 or even more cumulative weeks behind but reporting they were only three or four weeks behind – actually referring to Term Four only.
Both practices, along with simple deception,12 make it very misleading indeed to rely only on reported figures for coverage. However, once again, these essentially operational problems are relatively easily solved through improved management by officials and by HoDs and, especially, by the cross-checking of school reports against learner workbooks; both solutions are already part of the practice of a number of practitioners and departmental officials.13
While I do not suggest for one moment that operational and managerial changes are, in practice, simply and easily achieved by increased supervision, they are relatively easier to achieve simply because they are more readily understandable and more susceptible to standardised procedures than are more complex and abstract issues affecting curriculum coverage. They are also essential to achieve if we are to meet the national objectives of the education system. No matter what curriculum we adopt, it will still have to be systematically delivered in full each year to each grade level before we can expect to achieve the potential impacts it might have on learner performance.
More substantively and with wider implications, many teachers in both high and low performing schools are increasingly arguing that incomplete curriculum coverage is primarily caused by the unreasonable demands, especially of pacing, of the curriculum itself. This argument has become so widespread that it has been taken seriously and there is a growing recognition by educationalists and researchers that there are good grounds for a revision of the CAPS programmes.14
I do not doubt that CAPS would benefit from a review and some “tweaking” of its content, sequencing and pacing. However, I would argue that before we embark on (yet another) fundamental revision of our national curriculum – especially if it involves significant alterations to the complexity, pitch and “quantity” of content to be taught – there are other fundamental issues to be resolved.
The most immediate issue to consider is the number of weeks in the instructional year available within which to deliver the curriculum. In the research experience of the author, one of the biggest and most consistent differences between high performing and low performing schools is the higher number of weeks of instruction provided to learners in the former. Mouton and Schollar (2014) show that a sample of high performing schools provided between 35 and 37 weeks of classroom instruction over the year. On the other hand, it is common for the majority of schools to provide much less; common work schedules typically allocate two weeks per term to assessment (i.e. eight weeks of a 40-week school year, or 20% of the year) and there are multiple unplanned disruptions to schooling. These disruptions can be caused by late starts to terms and, especially, the absurdly extended period far too many schools use for “assessment” at the end of Term Four. Also significant are disruptions caused by meetings called by departmental offices,15 and by in-school training. Other instructional days are lost to events like bereavements, sports, health and cultural days, teacher union activity and so on. The upshot is that, in many schools, learners receive much less than 32 weeks of classroom instruction – in many schools the actual figure is, in fact, very much lower.
The DBE and Provincial Departments are increasingly aware of the need to improve time-on-task in our schools and to minimise the unplanned disruption of schooling but there is no doubt that they still have a mountain to climb in this regard. Nonetheless, it is still an operational issue and one that is relatively simple to remedy through standardised demands for instructional time and effective monitoring of compliance.
The point of the argument here is that it is manifestly unreasonable to consider reducing the demands of CAPS with regard to the pacing of the delivery of content without first establishing, equalising and institutionalising the number of instructional weeks required to deliver it. No doubt an enormous operational task in practice but, once again, relatively easy to achieve through standardised requirements and systemic monitoring.
The picture becomes rather more complex when we consider the issue of curriculum management, coverage and pacing with regard to the improvement of learner performance in high performing schools which already maximise, plan and monitor the instructional weeks they provide for learners.
In the study to which I referred earlier in this chapter, Mouton and Schollar (2014) found that, while the highest performing schools in matriculation mathematics were manifestly much more educationally functional than the great majority of (state) schools, the performance of learners at these schools nonetheless declined between 2008 and 2012. Teachers in these schools were asked to nominate the most significant barriers they experienced in improving both the quantity and quality of matriculation passes in mathematics. By far the most common response was the poor prior education of learners who eventually arrive in Grade 12 with significant existing and cumulative backlogs in content knowledge. This barrier was nominated as significant by 62% of these teachers and obtained a weighted value of 73% across all of the teachers.
Teachers generally reported that the competency demands and pacing of presentation in terms of conceptual and procedural content knowledge were both much higher in CAPS than in previous iterations of the curriculum. However, poor prior content knowledge, necessarily accompanied by promotion of learners to Grade 12 who had not grasped pre-Grade 12 content, made it very difficult to teach this content at the required pace while, at the same time, paying attention to learners who were well below the minimum expectations of learners at this level.
In this case, therefore, incomplete curriculum coverage was not caused by inadequate curriculum management – or by the excessive pacing demands of the curriculum. It was, instead, a consequence of a national assessment policy that progresses learners from one level of content complexity to the next almost irrespective of their actual attained competency level.
Just how widely divergent school level assessments and eventual departmentally approved pass rates can be was vividly illustrated for the author during a research visit to a school in Khayelitsha in October of 2017. Unfortunately, these data were also obtained during (baseline) research for the evaluation of an intervention programme operating across three provinces and are not yet in the public domain and, hence, cannot be formally acknowledged.16
During discussion of the issue of assessment, the Principal of this school printed out the results of internal school-based assessment in June of 2016. The (very well managed) school treats June assessments as diagnostic and lays stress on obtaining real judgements of learner competency free of any consideration of the pass/fail criteria based on national and provincial policy that they know will be applied at the end of the year. In Grade 8, the school tested 286 learners and, applying a pass mark of 50%, found that only 37 (13%) satisfied the competency levels described by the assessment standards of the NCS. In Grade 9, the corresponding figures were 240 tested and 34 (14%) “passed” the internal school assessment. Once these learners were assessed at the end of the year, over 95% were promoted to the next grade!
This is the second fundamental issue that must be addressed before we decide to embark on a wholesale revision of the content and pacing of CAPS. It is also the key issue to which we have returned throughout this paper as a contextual confounding variable affecting the achievement of significant impacts on learner performance by educational curricula and intervention treatments – the rise, on a national scale, of classes which are effectively multi-grade.
The effect of multi-grade classes
The opening section of this paper went into some detail to show that a great deal of reliable research over an extended period converged around an astonishing finding that around 80% of learners were below the minimum expected competency level for the grade in which they were enrolled. It also argued that gaps in content knowledge are cumulative and accelerate from one grade to the next manifesting, ultimately, in dismal performance in matriculation. It also argued specifically that this represented a collapse of grade/standard based mathematical education in South Africa. The implication for current public and private efforts to improve and sustain the quality of outcomes in schools, irrespective of the theoretical, managerial, operational or methodological approaches they employ, is significant indeed.
Consider, for example, a hypothetical “average” teacher of Grade 6 mathematics who is expected to teach and assess learners against the appropriate performance standards of the curriculum for Grade 6, with the necessary assumption that all of the learners in the class have “sufficiently mastered” the content and performance standards of the previous grades. In practice, using rounded SACMEQ figures and the South African grade equivalents, the teacher of an “average” Grade 6 mathematics class of 40 learners would instead have 34 learners who had not achieved the required minimum performance standards – with 16 of them at a Grade 3 competency level or lower. On the other end of the scale, there would be only six learners who had achieved a competence level at or above minimum expectations for Grade 6 level. Yet the teacher is expected to teach and assess learners as if they had all actually reached this level and were ready to move onto new content.
The consequence from the point of view of the learner is that a child at a Grade 3 level of subject competence may be expected to learn from Grade 6 lessons and materials and to solve problems that are based on operational procedures, number ranges and so on that are required at this grade level. There appears to be an implicit but universal assumption that learners taught at the correct level of complexity for the grade in which they are currently enrolled will, somehow, be able to rapidly “catch up” two, three or even four years of missed content and procedural competence while simultaneously learning the more complex content for the current grade.
All of the recent and current curriculum development initiatives at provincial and national levels, as well as those operated by independent foundations and agencies, have explicitly shared the idea that instruction, assessment and teaching/learning materials should be based on the assessment standards of the curriculum for each grade level. While this is intuitively and conventionally the obvious thing to do, the evidence I have reviewed very strongly indicates that it is based on an incorrect assumption. Learner abilities are distributed heterogeneously within the different grade levels that are, in turn, currently age-based rather than competency-based; the horse has already bolted, at least for the currently enrolled cohorts of learners.
The inescapable conclusion is that the great majority of South African classes on a national scale have become, in effect, multi-grade in terms of ability and that teachers are faced with an enormous range of learner abilities in mathematics, science and other subjects, from the virtually innumerate or illiterate to the small pool of the genuinely competent in every class they teach. This makes it next to impossible to teach to, or assess, all of the learners at the appropriate grade-based assessment standards of the curriculum and the likely result, in practice, is that learners of any level of ability are not exposed in full to the conceptual progression made explicit in the national curriculum.
In fact, the evidence suggests that, even if we did succeed in improving curriculum management to the point where the whole curriculum at the correct complexity level was delivered to all grades/classes each year, we would still not have solved the “meta” question of curriculum management and learner performance in its broadest sense. Covering the whole curriculum at the correct grade assessment/competency level is likely to further disadvantage, rather than assist, the great majority of learners who are below the minimum expected competency level for the grade in which they are enrolled.
Conclusions and Implications
The implications of the argument of this paper for PILO and for other programmes which aim to improve learner performance through improved curriculum management, are significant.
It is axiomatic that, for any curriculum, in whatever context, to have any chance of achieving positive impacts on learner performance, it must first be delivered effectively in practice. The establishment and institutionalisation of effective management, planning and monitoring systems is, therefore, a critical operational goal of its own. Current systemic attempts to improve curriculum management and, especially, monitoring of planned coverage, should not only continue but be intensified and spread on as wide a scale as possible through the routine structures of the respective departments of education and schools.
PILO, correctly in my view, places a great deal of attention on achieving these sorts of critical operational changes. To do so, their programme has adopted an approach that combines the systematic monitoring of curriculum coverage in both quantitative and qualitative terms with collaborative and participative responses to these monitoring data. Although I have referred to these sorts of changes as relatively easy to achieve because they are readily understandable and susceptible to standardisation, I have acknowledged that it is much easier to say than to do in a context as challenging as the South African school system. Consequently, if PILO were to succeed in achieving genuine improvements in curriculum management and coverage across whole districts and if these improvements resulted in improvements in learner performance, the programme would provide a developed model of change that could be adopted and tested on ever larger scales.
The close collaboration of PILO and departmental structures and officials is an important element of the PILO approach. They are dealing with what is, at base, a systemic set of problems that simply cannot be solved, or have solutions that can be sustained within the routine system, without the transfer of the substantive programme to the department itself and without its eventual institutionalisation in provincial, district and school practices. The fact that the PILO programme is presented and operated as an “official” element of departmental policy and practice serves two purposes: firstly it confirms to schools that this is not a typical NGO “project” that will come and go; and secondly, it helps to ensure that departmental policies and practices are aligned with and embedded in the PILO programme as far as curriculum management and planning is concerned.
Even given the limitations imposed by multi-grade classes, it is still likely that increasing curriculum coverage on a large scale will result in improvements in learner performance on an equally large scale. In short, the more of the curriculum covered by learners, the more chance they will have of improving their performance. However, this effect will very quickly have a “ceiling” beyond which further improvements will be difficult to achieve, given the multi-grade variable.
This chapter has argued that an essential part of the improvement process must be a determined effort on the national, provincial and district levels to increase, standardise and institutionalise the number of weeks in the school year during which classroom instruction is provided to learners. In short, the more time teachers have to deliver the curriculum, the more chance they have of covering more of it. In terms of classroom instruction, there should be a determined effort to increase the amount (and, eventually, quality) of the opportunities for written practice presented to learners. Improvements in this regard are also likely to result in improvements in performance. In short, the more opportunity learners are given to practice newly learned content, the more likely they are to improve their performance.
However, we are still left with the one unsolved confounding variable that will continue to depress the performance of all learners in all of our schools, at all grade levels and in all subjects, irrespective of anything else that is achieved. In my view, the effect of enormous variations in learner competency levels within and across grades and the effective reduction of all classes to multi-grade classes is the single most significant confounding contextual variable across the national school system. The effect of this variable is sufficiently significant to make it very difficult, if not impossible, for educational development programmes to achieve and sustain high levels of impact on learner performance. Equally, programme evaluation designs that fail to take this variable into account, when researching causative effects and models, run the risk of generating a False Negative; a strategic change model that may, in fact, be inherently effective can still fail to obtain significant impacts because of this variable.
For existing cohorts of learners, there appears to be no other feasible and achievable short-term solution that can support both low and high performing learners other than the introduction of diagnostic testing combined with some kind of “streaming”. The only research into this sort of option of which I am aware is my own doctoral research (Schollar, 2015) which shows that learner baseline scores could be doubled in a short time through a combination of diagnostic testing, learner workbooks designed to cover multiple grade competency levels to which learners were directed as a result of diagnostic testing and direct instruction using scripted lesson plans for teachers.
For future cohorts of learners in a grades/standards-based system, it is essential that National Assessment Policy ensures a more even and predictable flow of learners of roughly the same age and competency level from grade to grade. If, from Grade One onwards, learners are selected for “promotion” to the next grade against realistic competency standards, the currently impossible demand placed on teachers to cover the whole of the curriculum at the appropriate grade competency level will be reduced at each succeeding grade level. On the other hand, Assessment Policy could dispense with age altogether and focus only on competency as a criterion for “promotion” to the next grade. This, in essence, is what OBE posited as a fundamental principle back in 1998; each learner learns at his/her own pace.
There are obvious problems with and objections to both possibilities but there is no way we can continue to avoid acknowledging the effects of the spread, on a national scale, of such enormous variations in learner competencies.
In the long term, to be both equitable and effective in producing the skills and competencies for all learners required by a developing and transforming economy, any solution requires a more flexible and multi-path process through schooling. In short, many people, of whatever race, class or historical background, are unlikely to derive personal benefit from a school system aimed almost exclusively at preparation for university education.
References
- Andrich, D., & Douglas, G. (Eds.). (1982). Rasch models for measurement and psychological research. Education Research and Perspectives, 9(1), 5–118.
- Chinapah, V., H’ddigui, E., Kanjee, A., Falayajo, W., Fomba, C., Hamissou, O., Rafalimanana, A., & Byamugisha, A. (2000). With Africa, for Africa: Towards quality education for all: The 1999 MLA Project. Pretoria: Human Sciences Research Council.
- Christie, P., & Potterton, M. (1999). School development in South Africa: A research project to investigate strategic interventions for quality improvement in South African Schools: Final report. Johannesburg: University of the Witwatersrand Education.
- Coleman, J., Campbell, B., Hobson, C., McPartland, J., Mood, A., Winefeld, F., & York, R. (1966). Equality of educational opportunity report. Washington DC: U.S. Government Printing Office.
- Crouch, L., & Mabogoane, T. (1998). When the residuals matter more than the coefficients: An educational perspective. Journal for Studies in Economics and Econometrics, 22(2), 1–14.
- Crouch, L., & Vinjevold, P. (2006). South Africa: Access before quality and what to do now? Profesorado. Revista de currículum y formación del profesorado, 10(1), 1–16.
- Deaton, A. (2010). Instruments, randomization and learning about development. Journal of Economic Literature, 48(June), 424–445.
- Department of Education. (2003). Systemic evaluation: Foundation phase: Mainstream national report. Pretoria: Chief Directorate: Quality Assurance.
- Department of Education. (2005). Intermediate phase systemic evaluation report, Pretoria: Government Printer.
- Fleisch, B. (2008). Primary education in crisis: Why South African school children underachieve in reading and mathematics. Johannesburg: Juta & Co.
- Gustafsson, M., & Mabogoane, T. (2010). South Africa’s economics of education: A stocktaking and an agenda for the way forward. Stellenbosch Economic Working Papers. Stellenbosch. 06/10.
- Howie, S. (2000). Third International Maths and Science Study Repeat: Executive Summary. Pretoria: Human Sciences Research Council.
- Jansen, J. (2013). Personal reflections on policy and school quality in South Africa: When the politics of disgust meets the politics of distrust. In: Y. Sayed, A. Kanjee, & M. Nkomo (Eds.), The search for quality education in post-apartheid South Africa: Interventions to improve learning and teaching. Pretoria: HSRC Press, pp. 81–95.
- Moloi, M. Q. (2006). Mathematics achievement in South Africa: A comparison of the official curriculum with pupil performance in the SACMEQ II project. Presented to the Consortium for Research on Schooling. Stellenbosch Seminar: Stellenbosch.
- Moloi, M., & Strauss, J. (2005). The SACMEQ II Project in South Africa: A study of the conditions of schooling and the quality of education. South Africa working paper. SACMEQ Educational Policy Research Series.
- Mouton, J., & Schollar, E. (2014). Epoch and optima trusts: Public schools maths challenge programme: An impact evaluation. Prepared for the Epoch and Optima Trusts of Tshikululu Social Investments.
- Mullis, J., Martin, M., Gonzalez, E., & Chrostowski, S. (2004). TIMSS 2003 International Mathematics Report. Chestnut Hill, MA: International Association for the Evaluation of Educational Achievement: Lynch School of Education, Boston College.
- Roberts, J. (2005). Baseline evaluation of the Mveledzandivho project. Johannesburg: JET Education Services.
- Roberts, J. (2006). Final evaluation of the COUNT project in Uitenhage. Prepared for the Zenex Foundation.
- Roberts, J., & Schollar, E. (2006). Meta-Evaluation of 23 Intervention Projects in Mathematics, Science and Language: 1998–2006. Prepared for the Independent Schools Association of Southern Africa.
- SACMEQ, see Southern and Eastern Africa Consortium for Monitoring Educational Quality.
- Schollar, E. (2015). The Primary Mathematics Research Project: 2004–2012. An evidence-based programme of research into understanding and improving the outcomes of mathematical education in South African primary schools. PhD thesis. Department of Sociology, University of Cape Town, Cape Town.
- Schollar, E. (2016). Evaluation of the University of Johannesburg school development practitioner programme. Prepared for the ELMA Foundation and USAID.
- Seekings, J. (2001). Report for the Parliament of South Africa: Making an informed investment – improving the value of public expenditure in primary and secondary schooling in South Africa. CSSR/UCT. Commissioned by the Standing Committee on Public Accounts (SCOPA).
- Simkins, C. (2013). Performance in the South African Educational System: What do we know? Report Commissioned by CDE: Johannesburg.
- Southern and Eastern Africa Consortium for Monitoring Educational Quality. [S.a.]. Data for all research phases. Retrieved from: http://www.sacmeq.org/sacmeq-projects/sacmeq-iii
- Spaull, N. (2013). South Africa’s education crisis: The quality of education in South Africa 1994–2011. Report commissioned by CDE.
- Taylor, N., & Moyana, J. (2005). Khanyisa education support programme - Baseline Part 1: Communities, schools and classrooms. Johannesburg: JET Education Services.
- Taylor, N. C., Muller, J. P., & Vinjevold, P. (2003). Getting schools working: Research and systemic school reform in South Africa. Cape Town: Pearson Education Publishers.
- Taylor, N., & Vinjevold, P. (Eds.). (1999). Getting learning right: Report of the President’s education initiative research project. Johannesburg: Joint Education Trust.
- Van der Berg, S. (2007). Apartheid’s enduring legacy: Inequalities in education. Journal of African Economies, 16(5), 849–880.
Notes
-
http://www.fin24.com/Economy/sa-spends-more-on-education-than-us-uk-and-germany-20170105 ↩
-
Just under half of the learners were black, the rest white, coloured and Indian. ↩
-
Research showed that learner workbooks in these schools have a much higher number of pages completed than in the usual state school. In fact, they have generally completed all pages in several workbooks. This difference, and the much higher number of weeks of instruction provided to learners, are probably the most obvious differences between high and low-performing schools in South Africa. The two factors are obviously related; the more weeks of instruction provided, the more opportunity to complete class work. ↩
-
We are not here referring to the recently introduced Annual National Assessments (ANA) administered by schools themselves but to the original NSE that collected rather more reliable data through the use of random samples and the external administration and scoring of test scripts. ↩
-
Southern and Eastern Africa Consortium for Monitoring Educational Quality [SACMEQ]. Retrieved from: http://www.sacmeq.org/sacmeq-projects/sacmeq-iii ↩
-
The MLA did not provide information of this sort and is excluded from the comparison though it is clear that the findings of that study do not suggest a contradictory conclusion. ↩
-
This runs parallel to the findings of the USA Coleman Report of 1966: “Whatever may be the combination of nonschool factors – poverty, community attitudes, low educational level of parents – which put minority children at a disadvantage in verbal and nonverbal skills when they enter the first grade, the fact is the schools have not overcome it” (Coleman et al., 1966, 22). ↩
-
http://www.jet.org.za/ ↩
-
https://www.education.gov.za/NEEDU.aspx ↩
-
http://nect.org.za/ ↩
-
Learning to play a musical instrument is perhaps the clearest example of this argument. Great musicians have achieved an astonishing mind-body coordination and creative expression through extended periods of repetitive practice. The basic principle applies just as well to learning to ride a bicycle, performing mathematical operations or producing sustained pieces of written text. ↩
-
Reporting a topic as covered when it has not been treated at all. ↩
-
The capacity of departmental officials to carry out verification exercises is limited by their own numbers, as well as teacher resistance to “fault finding”. ↩
-
I am not aware of any formal literature on this issue and am referring here to personal and professional conversations with curriculum specialists. ↩
-
Even when these meetings are planned for after school hours, travel time, especially in rural areas, can still result in the loss of instructional time. ↩
-
I am certain there will be no objection to identifying both of the current evaluation studies to which I refer in this paper to the commissioning editor, should verification be required. ↩