8 Exploring mathematics teachers’ usage of the curriculum planner and tracker in secondary schools in King Cetshwayo and Pinetown districts
Author and publication details
Thokozani Mkhwanazi, School of Education, University of KwaZulu-Natal, Mkhwanazit2@ukzn.ac.za; Zanele Ndlovu, School of Education, University of KwaZulu-Natal, Ndlovuz3@ukzn.ac.za; Sebenzile Ngema, School of Education, University of KwaZulu-Natal, Ngemas@ukzn.ac.za; Sarah Bansilal, School of Education, University of KwaZulu-Natal, BansilalS@ukzn.ac.za
Published in: Christie, P. & Monyokolo, M. (Eds). (2018). Learning about sustainable change in education in South Africa: the Jika iMfundo campaign 2015-2017. Saide: Johannesburg.
Download PDFIntroduction
It is well established by now that South African learners perform extremely poorly in mathematics, particularly at secondary level. Findings from the Annual National Assessment (ANA) have indicated that the national average for Grade 9 learners was 13% in 2012, 14% in 2013 and 11% in 2014 (Department of Basic Education [DBE], 2014). The same poor performance is indicated in the National Senior Certificate (NSC) mathematics pass rate which was 53,5% in 2014, 49,1% in 2015 and 51,1% in 2016 (DBE, 2016). Inadequate curriculum coverage, with teachers apparently neglecting to cover certain aspects of the curriculum, is one of the reasons identified for learners’ poor performance in mathematics (Mji & Makgatho, 2006; DBE, 2014, 2016). According to the curriculum management and delivery strategy of the KwaZulu-Natal Department of Education (2012), there is a need for an effective strategy for monitoring curriculum delivery that will inform the system of the extent to which learners are achieving the set learning outcomes.
In response to the crisis of poor performance and in line with suggestions by the DBE, the Programme for Improving Learning Outcomes (PILO), in partnership with the KZNDoE, launched a new intervention programme, called Jika iMfundo, in two education districts in KZN. The main aim of this intervention is to provide district officials, teachers and School Management Teams with appropriate tools and training to enable them to initiate professional, supportive and evidence-based conversations about curriculum coverage. This would improve the learning outcomes (LOs), as suggested by the Theory of Change that informs the programme.
Jika iMfundo was formally rolled out as a pilot project in the King Cetshwayo and Pinetown districts in KZN in 2015 and 2016. Teachers were provided with two curriculum tools (CTs), the curriculum planner and tracker, to regularise curriculum coverage and ensure alignment between their teaching and the Curriculum Assessment Policy Statements (CAPS). Heads of Departments (HoDs) were also provided with supervision tools and training for their role in monitoring teachers’ curriculum coverage and supporting them in their work.
However, the successful implementation of an intervention programme in education involves more than providing teachers with tools, materials, resources and training. It needs to be recognised that teachers respond to new intervention programmes differently, reflecting their individual beliefs and attitudes (Carless, 1997). Since the introduction of the Jika iMfundo programme in 2015, initial findings have revealed a differential rate of uptake by teachers, with a low rate of utilisation of the CTs by mathematics teachers, especially in secondary schools. This claim is illustrated by Table 8.1, which is taken from the PILO survey in 2015, showing tracker use in the Pinetown district.
| Pinetown School Reviews | ||||
|---|---|---|---|---|
| Q1. In your opinion are the trackers being used routinely? | Yes | To some extent | Don’t know | Not at all |
| Foundation phase | 85% | 15% | ||
| Intermediate (Grade 4) | 67% | 27% | 7% | |
| Maths (Secondary) | 48% | 39% | 13% | |
| Natural Science (Secondary) | 83% | 17% | ||
| English (FAL) | 62% | 38% |
Tracker usage in Pinetown
Table 8.1 Tracker usage in Pinetown
Table 8.1 shows that fewer than 50% of secondary school mathematics teachers in this district used the tracker routinely, while 13% did not use it all. Why is this? The reasons for this low utilisation require further investigation. Consequently, this study explores the degree of take-up of the CT by teachers of mathematics and their reasons for this.
Accordingly, the research questions were:
- To what extent have mathematics teachers used the CT?
- What are the challenges that hinder mathematics teachers from using the CT?
- What are the enabling factors that enhance the usage of the CT by mathematics teachers?
- How, if at all, has the introduction of the CT influenced the rate of curriculum coverage?
Conceptual framework
The central principle that informs Jika iMfundo is that, if curriculum coverage improves, then the LOs will be improved. Indeed, many studies point to the low content coverage in the classroom as a reason for the persistently poor LOs in mathematics (Stols, 2013; Taylor, 2011; Reeves & Muller, 2005). Stols (2013, p. 2) highlights the role of time on task, commenting that “successful learning outcomes should not be expected without sufficient teaching and practice opportunities.” Comparing the days spent on each topic to the time recommended by the Gauteng DoE, Stols (2013) finds that the average number of days spent on most topics was half the suggested number of days. According to the workbooks examined, the average number of active learning days in this sample was 54.1 days per annum (Stols, 2013). A study by Reeves and Muller (2005) also reveals limited curriculum coverage, with the average coverage of essential mathematics concepts being 29% for Grade 5 and 22% for Grade 6. Of greater concern was the finding that 71% of the topics covered by 50% or more of the learners in Grade 6 were also covered in at least 50% of the classes in Grade 5.
Research studies also point to the link between coverage and learner outcomes. Taylor’s (2011) study finds a positive and significant effect on mathematics scores of Grade 6 learners who covered more than 25 curriculum topics as identified in learner workbooks. A study focusing on learners’ workbooks in four KZN schools by Bansilal, Zondi and Shabalala (2016) finds large variations in activity amongst the schools. They find that the school with the highest ANA average in Grade 9 (37%) offered its learners 1001 practice exercises, compared to the limited 73 exercises in a second school whose ANA average was 2.3%. The study also identified wide variations in the number of lessons within a school. In one school, the three learner books had 44, 80 and 28 lesson dates, showing that different teachers taught different numbers of lessons to the Grade 9 learners (Bansilal et al., 2016).
Graven (2016) asserts that a benefit of intervention programmes is that they can increase teacher confidence and commitment to practices that foreground sense-making and conceptual understanding of mathematics concepts. What is it, then, that can influence teachers’ decisions about taking on board new curriculum innovations? Studies suggest that multiple factors can influence mathematics teachers to use and learn from curriculum support materials. The teachers’ subject matter knowledge and pedagogy may influence which parts of the curriculum teachers read and use within their enactments with students (Zangori, Forbes, & Biggers, 2013; Charalambous & Hill, 2012). Pedagogical knowledge of teachers includes their abilities to use their knowledge, their beliefs and goals to make productive decisions about enacting the curriculum (Brown, 2009). Adding evidence, Davis and Krajcik (2005) emphasise the fact that teachers’ use of curriculum materials also depends on the teachers’ persistence (or lack thereof) in studying the materials and the teachers’ own knowledge and beliefs. Jones and Eick (2007) add more factors, such as teachers’ orientation towards the curriculum materials, knowledge and beliefs about their students, level of comfort with the content or curriculum and goals, beliefs, agency and experience.
Clearly, the extent to which teachers undertake an innovation depends on whether they see it as adding to their load or easing the demands they face. Carless’ (1997) study on the implementation of Hong Kong’s target-oriented curriculum raises the point that it is the teacher’s perception of the practicality of an innovation that will strongly influence their willingness to implement it. He identifies one of the dimensions of practicality as “the extent to which the innovation is compatible with existing classroom practices” (Carless, 1997, p. 352). This means that an innovation that is associated with major reorganisation or new practices is less likely to be taken up than one which is planned according to the teacher’s needs in a manner that does not disrupt existing practices. A further factor identified by Carless (1997) that influences the reception of an innovation is whether or not the implementers (teachers and school leaders) take ownership of it. Ownership is defined as “the degree to which an innovation ‘belongs’ to the implementers” (Carless, 1997, p. 352).
Another factor that is consistently raised is the importance of a supportive environment, where everybody works together to improve the teaching and LOs. The World Bank’s (2017) World Development Report emphasises the importance of alignment between the various role-players in the schooling system. The report claims that the best innovations in the world will not have an impact on improvement in outcomes if systems do not work together as a whole. It raises the point that poor school management and governance undermine schooling quality and that effective school leadership has an indirect positive impact on learning improvement. It is often the case that the lack of resources is used as a reason for problems of education quality. Although it is important that enough resources be devoted to education, the World Bank Report cautions that resource shortages can explain only a small part of the learning problems and poor results that it identifies. The report states that it is evident that “across systems and schools, similar levels of resources are often associated with vast differences in learning outcomes” (World Bank, 2017, p. 13). Bhengu and Mkhize (2013) assert that quality can be improved when school leaders ensure that the activities in schools focus on improving instruction. The authors highlight the importance of developing a “supportive environment in which teaching, learning and their relationship with other school practices is the focus of the deliberations” (2013, p. S36).
The report by the National Education Evaluation and Development Unit (NEEDU) (2017, p. 3) argues that one of the biggest differences between teaching in well-functioning and poorly-functioning schools is that the first type is a well-supported system, where teachers, learners and school management “simply do what they are supposed to do, exactly how they are supposed to do it, when they are supposed to do it.” In well-supported systems, each person is well-placed to deal with their responsibilities in their sphere and tasks are completed and managed at the different levels within a distributed knowledge system. Taylor (2011, p. 4) notes that, in a well-functioning school, the Principal and staff work together in systems which support the work of teaching and learning, as a “structured division of labour distributes functions and integrates curriculum delivery across the classroom, the school and the home.” There are school-level systems in place for issues such as time management, absenteeism, discipline, curriculum planning, monitoring and assessment, as well as teacher professional development. In contrast, in poorly-supported schools, there is a poor understanding of the roles of the various structures and problems often escalate because they have not been managed at the level at which they should have been in a functioning system.
When school functionality is compromised, it is often the teachers who have to deal with added constraints. Bansilal and Rosenberg (2011) argue that the myriad problems faced by teachers casts an inertial effect on the teachers’ abilities to function on a day-to-day basis. The authors argue that the space for teacher learning becomes constrained as teachers become preoccupied with managing the problems of practice emanating from outside their classroom, instead of reflecting on pedagogical problems of practice which could activate rich learning opportunities.
Elmore (2004, p. 11) argues that the principle of reciprocity should govern the relationship between the leadership and teachers: “I can only do, as a teacher, what I know how to do. So your responsibility as a leader is to set the conditions in place that permit me to have access to do the work that you as a leader expect me to do.” Elmore terms this “reciprocal accountability”. A second type of accountability identified by Elmore as being important for school improvement is that of the “internal accountability” which occurs within an organisational unit like the school or a team. It is the responsibility of the teacher to provide the necessary learning opportunities to learners, so that they have an equitable chance of participating in mathematics. However, teachers can only do what is expected of them provided they have access to the necessary support and this accountability is applicable at each level of the responsibility ladder. The HoD needs support from school management which, in turn, needs support from educational authorities. Elmore (2008b, p. 6) argues that internal accountability “is the degree of coherence in the organization around norms, values, expectations and processes for getting the work done.”
Hence, it is clear that any curriculum intervention must be accompanied by a focus on strengthening of the internal accountability system within a school. In particular, for the purposes of this chapter, the accountability at the interface between the mathematics teacher and the HoD (as a subject leader in the school) is a crucial layer within the reciprocal accountability system of the school as a whole.
Research methodology
Research design
The purpose of this research was to explore mathematics teachers’ usage of the CT in secondary schools and to determine whether the introduction of the CT influenced the rate of curriculum coverage. To investigate these issues, we adopted a broadly qualitative approach since this provides multiple ways of understanding the inherent complexity and variability of human behaviour and experiences (Grace, Higgs, & Horsfall, 2009; Creswell, 2009). Our focus in this research was to understand the implementation of the CT from the teachers’ and HoDs’ perspectives, since they are the ones involved with managing the curriculum and its implementation at classroom level.
Sampling
In selecting schools, we used PILO survey data to identify schools teaching secondary mathematics in the two districts. PILO surveys revealed that there were 176 schools teaching secondary mathematics in Pinetown (175 secondary schools + 1 combined school) and 229 schools teaching secondary mathematics in King Cetshwayo (127 secondary schools + 102 combined schools). PILO conducted four surveys in schools within the two districts, namely,
- School Review Survey of November 2015 (SR-2015)
- Self-Evaluation Survey of February/March 2016 (SE-2016)
- Curriculum Coverage Survey of August 2016 (AS-2016)
- School Review Survey of November 2016 (SR-2016).
Table 8.2 indicates the number of schools that participated in each of the four PILO surveys applicable to our study.
| Type of Survey | SR-2015 | SE-2016 | AS-2016 | SR-2016 |
|---|---|---|---|---|
| Schools in Pinetown | 24 | 142 | 12 | 6 |
| Schools in King Cetshwayo | 23 | 209 | 17 | 12 |
Number of schools reviewed by PILO
Table 8.2 Number of schools reviewed by PILO
We selected our sample based on schools’ participation in PILO surveys, focusing, in particular, on schools that have the most information in the surveys. Initially, we selected 16 schools spread across the two districts, but it was not possible to include two of these in school visits in 2017 which then reduced our sample to 14 schools. We used pseudonyms as an alternative to the real names of the schools in our sample from each district, in line with ethical considerations and guaranteed confidentiality to participants. Information on the schools in the study is presented in Table 8.3.
| District | Secondary Schools | SR-2015 | SE-2016 | AS-2016 | SR-2016 | ANA% Av. Gr 9, 2013 | ANA% Av. Gr 9, 2014 |
|---|---|---|---|---|---|---|---|
| Pinetown | GLEV | × | ✓ | ✓ | ✓ | 24,29 | 12,69 |
| ISIZ | × | ✓ | ✓ | ✓ | 4,7 | 2,45 | |
| KWABA | ✓ | ✓ | ✓ | × | 8,4 | 5,31 | |
| PHO | × | ✓ | ✓ | ✓ | 13,15 | 5,23 | |
| ZIPA* | × | ✓ | ✓ | ✓ | --- | 1,84 | |
| ZWELI | ✓ | ✓ | × | ✓ | 11,48 | 1,36 | |
| King Cetshwayo | EKU | × | ✓ | ✓ | ✓ | 6,46 | 3,31 |
| ELA* | ✓ | ✓ | ✓ | × | 7,31 | 2,17 | |
| EMO | ✓ | ✓ | ✓ | ✓ | 6,29 | --- | |
| HLAKA | ✓ | ✓ | ✓ | ✓ | 7,2 | 4,74 | |
| JOHR | × | ✓ | ✓ | ✓ | 28,83 | 14,3 | |
| MGI | × | ✓ | ✓ | ✓ | 6,36 | 3,08 | |
| QHA | × | ✓ | ✓ | ✓ | 6,09 | 3,23 | |
| TISA | × | ✓ | ✓ | ✓ | 18,89 | 12,24 | |
| UMZI | × | ✓ | ✓ | ✓ | 8,05 | 3,26 | |
| ZIPHO | ✓ | ✓ | ✓ | ✓ | 10,41 | 5,22 |
Schools chosen for in-depth study
Table 8.3 Schools chosen for in-depth study
* Omitted from sample
The ANA results for the Grade 9 mathematics were very poor across the country. However, it was a concern that, for many schools, there was an even further drop in the average scores for 2014 as compared to 2013. This drastic drop illustrates the seriousness of the problem in Senior Phase mathematics but exploring it further was beyond the scope of our research.
However, research suggests that the difficulty level of the Grade 9 ANA mathematics test was high. A study (Bansilal, 2017) focusing on the 2014 Grade 9 ANA mathematics test in five high performing KZN schools, found the results from the ANA were statistically significantly lower than those produced by each of the schools’ final examinations. The teachers’ views were that there were too many higher-level questions in the ANA catering for the brighter learner only. They suggested that the test should include more questions that were uncomplicated and tested routine skills that could enable average learners to display their competence. Furthermore, teachers felt that the learners were not yet ready for the type of reasoning asked in the geometry questions and suggested that the test should include more calculations in geometry and fewer proofs. This burden of proof was also identified by Pournara, Mpofu and Sanders (2015) who argue that the geometry items were dominated by formal proof requirements which seem to be beyond the curriculum specifications.
Data generation
With the aim of understanding the complexities and experiences of teachers on the uptake of the Jika iMfundo CT and to provide information and evidence about curriculum coverage, we used three different sources of data collection: the PILO survey data, together with interviews and documentary data from classroom materials. As well as analysing the PILO data for participants’ reports, we conducted 21 semi-structured interviews with teachers and HoDs in the sample schools in 2017. Interviews enable probing to obtain greater depth of understanding (Cohen, Manion, & Morrison, 2011) and we designed our interview questions to clarify responses made by teachers and HoDs
Table 8.4 presents the number of participants interviewed in the 14 schools, together with sources of information that were presented during the interviews in August 2017.
| Schools | GET | FET | HoD | Total # of participants | No. of interviews | Sources of information |
|---|---|---|---|---|---|---|
| GLEV | 3 | 1 | 4 | 1 | CT; MS; SFAT; DMB; LCB | |
| ISIZ | 1 | 1 | 1 | 3 | 2 | CT; LCB; SFAT; MS |
| KWABA | 1 | 1 | 1 | CT; LCB; SFAT; MS; DBEWB | ||
| PHO | 1 | 1 | 1 | CT; LCB | ||
| ZWELI | 1 | 1 | 1 | 3 | 2 | CT |
| EKU | 1 | 1 | 2 | 2 | CT; LCB; SFAT; MS | |
| EMO | 1 | 1 | 1 | LCB; SFAT | ||
| HLAKA | 1 | 1 | 1 | CT | ||
| JOHR | 2 | 1 | 1 | 4 | 1 | CT; CAPS ATP |
| MGI | 1 | 1 | 2 | 1 | CT; MS; SFAT; DMB; LCB | |
| QHA | 1 | 1 | 2 | 2 | CT; LCB; MS; SFAT | |
| TISA | 1 | 1 | 1 | 3 | 3 | CT; LCB; MS; SFT; |
| UMZI | 1 | 1 | 1 | CT; LCB | ||
| ZIPHO | 1 | 1 | 2 | 2 | CT; LCB | |
| TOTALS | 14 | 7 | 9 | 30 | 21 | |
| Code for sources of information | Tracker (CT); Mark sheet (MS); DBE workbooks (DBEWB); Learners' Classwork books (LCB); Scripts for formal assessment tasks (SFAT); Departmental Minute Book (DMB); Annual Teaching Plan (ATP) | |||||
Participants Interviewed in 2017
Table 8.4 Participants Interviewed in 2017
Data analysis
The data set used for this chapter comprised transcripts from the survey materials collected by PILO from the secondary school mathematics teachers and HoDs in 2015 and 2016 and transcripts from the 21 interviews conducted in 2017 (mainly with teachers). To verify data from interviews further, classroom materials were also considered as a data source. When analysing these data sources, we adhered to the framework and guidelines offered by Miles and Huberman (1994). Initial analytical steps involved immersion in the data through the transcription process and the organisation of data into categories. This was followed by coding and inducing themes in data generated from transcripts from the PILO surveys and interviews. For issues of validity, the four researchers met to triangulate their responses and, at this stage, relationships between codes were identified and elaborated. As well as providing us with textual data, this form of analysis helped us to generate quantitative data to give us a broader understanding of the proportion of the uptake of the CT by teachers. Finally, the researchers synthesised the coded data together, aligning it with the research questions. The aim was to ensure that the emerging themes formed a recognisable cluster grounded within one general concept.
Findings and discussion
This section discusses the findings which were organised under the major themes that were identified, aligned to our research questions.
Usage of the curriculum tools (planner and tracker)
Our research set out to investigate the reasons for reported low CT use by secondary mathematics teachers and, in particular, to explore the perspectives of teachers and HoDs themselves since their participation is essential for the success of the Jika iMfundo intervention. Our analysis of PILO survey responses, interviews and documentation confirmed the low CT use by mathematics teachers and HoDs. In addition, we found a number of instances where teachers and HoDs reported that they were using the CT for its intended purpose, but they were unable to provide evidence to verify these claims. In cases where there was evidence, this showed minimal and inconsistent usage.
Of the 14 schools whose data we analysed, only six were reviewed in 2015 (SR-2015); all 14 schools were reviewed in 2016 (AS-2016); and 12 were reviewed later in the same year (SR-2016). Of the six schools that were reviewed in 2015, only two (ISIZ and EKU) reported that they used the CT routinely. In the first PILO survey of the following year (AS-2016), nine reported routine use of the CT – an apparent increase, perhaps as teachers were becoming more conversant with the CT. The second PILO survey (SR-2016), however, shows that seven schools were using the CT. The two schools (QHA and ZIPA) that were no longer using the CT routinely cited several challenges, including the late arrival of the CT and internal disruptions. Across both of the 2016 surveys, over 50% of the schools that were reviewed reported routine usage of the CT. However, there was no tangible evidence to support these claims, so these remained at the level of self-reporting. In fact, of the nine schools that indicated routine usage of the CT in the first of the 2016 surveys (AS-2016), only five had their responses verified by PILO coaches to confirm that the CT was being used routinely. The same self-reporting trend was evident in the second survey (SR-2016).
Of the two schools that indicated routine usage of the CT in 2015, one (ISIZ) showed consistency across all reviews based on the self-reported data. During the interviews in 2017, the teacher and HoD at ISIZ maintained that they used the CT all the time. However, the verification by the researcher contradicted their responses. It was found that the Grade 9 mathematics teacher had completed only two weeks of the tracker in term 1 and one week in term 2, thus showing minimal and inconsistent usage of the CT. This suggests that it is possible that there had been no change, at ISIZ, in the amount of work given to learners since 2013. The decline in the school’s ANA results (from an average of 8,4% in 2013 to an average of 2,5% in 2014) supports this argument. These findings would be consistent with Bansilal et al. (2016) who showed that the schools that offered learners fewer practice examples performed more poorly than those that offered sufficient practice examples.
A similar scenario was observed at the second school (EKU), where a Grade 9 teacher reported that he used the CT routinely and his copy of the CT confirmed that he marked the relevant sections as complete according to the dates specified in the CT (Figure 8.1). However, learners’ exercise books contradicted the teachers’ signature of completion appearing in the CT. The Grade 9 CT indicates that teachers should teach Pythagoras’ theorem in Week 1 of Term 2, but the work in the learners’ books was about circles, thus illustrating non-adherence to the suggested sequencing in the CT. During the interviews in 2017, the teacher conceded that, in reality, he did not follow the sequence in the CT but rather filled in the dates according to the CT, saying: “Sometimes I do not follow the tracker, when I realise that learners are blank I teach something else.”

Copy of Grade 9 teacher’s CT confirms that he marked the relevant sections as complete, but the work in his learners’ exercise books contradict the teacher’s signature of completion. The HoD was also found not to be completing proper monitoring.
Figure 8.1 Copy of Grade 9 teacher’s CT confirms that he marked the relevant sections as complete, but the work in his learners’ exercise books contradict the teacher’s signature of completion. The HoD was also found not to be completing proper monitoring.
Furthermore, we found evidence of duplicity between the teachers and HoDs, where signatures were made for compliance purposes. Figure 8.1 shows that the teacher signed the tracker on 21/04/2017, signifying that he completed that week’s work. It can be observed, however, that the HoD signed the tracker for Term 2 on 07/04/2017 – which was even before the term resumed on 20 April 2017. When asked about this, it was clear that the HoD was aware that, in order to fulfil his monitoring functions, he was supposed to sign after the work was covered. However, he could not explain why, in this case, he had signed even before the term started. While the teacher claimed to have given trackers to the HoD at the end of each week, there was only one HoD signature in the tracker which was on the 7 April 2017. Although one cannot refute the claims made by the teacher and HoD, without tangible evidence, they are questionable.
The noticeable trend between the three sources of data was that, while many teachers reported that they were using the tracker, the verification actually shows that only a few used the tracker routinely and appropriately. During the interviews in 2017, we found that only three schools used the CT routinely and had the evidence to back it up. The learner books analysed from GLEV, JOHR and TISA showed that they had done more exercises per topic than the expected norm. Even though their ANA results in 2014 were not impressive, their percentage averages were higher than other schools in our sample, thus confirming that exposing learners to more practice examples increases the chances of learner achievement.
Methodologically, our findings show that self-reported data are not reliable and need additional data sources for verification.
Challenges in using the curriculum planner and tracker
Our research also set out to explore teachers’ perspectives on CT usage, including the challenges hindering CT use (as well as enablers enhancing use). More than 50% of the schools in our sample identified specific challenges that hindered the usage of the CT. Schools that were using the CT routinely also encountered challenges, but managed to rise above them. The major challenges mentioned relate to the tracker itself, to teacher knowledge and attitudes towards the intervention and to conditions in schools more broadly. These are set out below.
Tracker neglects learner pace
Participants in all of the 14 schools in the study pointed out that one of the challenges they encountered with the usage of CTs was that they did not cater for the mastery of the concepts because they neglected learner pace. In the words of a teacher at EMO:
What I am supposed to cover in one day according to tracker takes me three days with learners, so every time I am behind. Then I chose to ignore the tracker since it makes me feel guilty all the time as if I am not doing the work.
Although teachers, at times, seemed to attribute the problems of pace and overload to the CT, it is important to note that the pace of the coverage of the topics is dictated by the CAPS curriculum and Annual Teaching Plan (ATP) and not the CT, since the CT functions to provide a detailed breakdown of how the topics in CAPS could be covered. In interviews, teachers and HoDs noted that they were aware that the problem was related to CAPS. The HoD at EKU pointed out that the CAPS and ATP are too packed and teachers feel overwhelmed by the amount of work they need to cover in a week. Even though he expressed these problems, this HoD also said that the CT does help him to know the extent of the content to be covered which was not the case before.
From the interviews, it would seem that teachers and HoDs understand that the CT is tracking the CAPS document which means that it is what they are expected to cover. However, this knowledge does not help them in addressing the challenge of how to keep up with content coverage when learners are falling behind. Thus, it seems that the CT has emphasised for them the challenge of an overloaded curriculum without providing a means to remedy it; instead, it makes some teachers feel demotivated. As indicated in the opening sentence, all 14 schools raised this challenge of content overload which shows that it was a common perception between teachers and HoDs.
Tracker sequencing and inflexibility
One of the challenges raised mainly by seven teachers who reported using CT routinely, was that its inflexibility and sequencing do not give teachers room to manoeuvre the topics. While this challenge could also be attributed to CAPS, teachers felt that the breakdown of concepts into days in the CTs forced them to follow it day-by-day, instead of allowing them to teach as they saw fit which is what they used to do with CAPS. For example, one teacher at EKU said:
Sometimes when I introduce a topic, I found that learners are blank, but I am forced to follow it through because, if I don’t, I would be seen as someone not covering the curriculum. Anyway, I do change it, for example, when teaching Pythagoras’ theorem, I might decide it is better to first teach types of triangles before introducing Pythagoras’ theorem.
The same sentiment was raised by a teacher at TISA:
The tracker is rigid and does not allow for different approaches … I prefer to start with solving for x, then factorisation before the introduction of a quadratic formula … I teach the topic and then take a learner exercise book to check for end dates for recording in the tracker.
This comment indicates that the teachers used the tracker for reference and recording purposes and not as a tool around which their lessons could be planned. In addition, it shows that teachers were drawing on their own experiences and judgement which illustrates the point made in the literature review that teachers’ practices are not easily shifted. As pointed out by Jones and Eick (2007), teachers’ take-up of an innovation depends on whether they see it as adding to their load or easing the demands they face. In this scenario, teachers see the CT as making things more difficult for them by restricting their flexibility and ability to respond, as they think best, to learner needs. The daily stipulation of topics also restricted them from engaging in and making decisions based on their own pedagogic reasoning.
Use of other curriculum-tracking tools
Eight teachers pointed out that one of the reasons for not using the CT was that they used other tools that they found to be more flexible and convenient. They explained that they viewed the CT as an exercise in duplication instead of being helpful to them. This claim is reflected by sentiments from a HoD at UMZI:
I see that the tracker has been taken from ATP. The ATP gives you a longer time frame, as well as the work coverage. So I used the ATP instead.
This comment shows that, regardless of the purpose of the intervention that is being implemented, teachers or HoDs use their own professional judgement to decide on the extent to which they will use the given tool or resource.
A second reason that was provided for not using the tracker was that authorities did not encourage it. A teacher at ZWELI explained that “even our Subject Advisers are biased towards the ATP and, at no stage, was the tracker promoted in the workshops that I attended.” Another teacher, from GLEV, said “I do not follow the CT 100% because our subject advisor said you don’t have to follow it.” Of the eight teachers who cited authority as the reason, six reported minimal usage of the CT.
Another reason raised by teachers from KWABA and EMO for choosing to use tools other than CT was the lack of alignment of content to be covered between the CT and the ATP. As a result, teachers chose to use the ATP since it aligned with the examination guidelines which they need to follow. When probed about this, a comment from a teacher at KWABA was:
Last year I had a bad experience when I was using the tracker. It said that in Term 2, I had to cover Trigonometry but the ATP said that Trigonometry should be covered in Term 3.
The same issue was raised during the 2017 interview with the teachers. This suggests that the choice to use the ATP was mainly driven by the expectation that they meet the examination guidelines, while the CT focuses on tracking the curriculum.
From the PILO surveys and our interviews, especially in Grades 8 and 9, it emerged that teachers preferred to use the “1+9” programme of lesson plans because they felt it was much easier to use. The “1+9” is an intervention programme launched by the KZNDoE in 2015 to improve teachers’ mathematical knowledge for teaching. In this programme, teachers are provided with lesson plans, so it is possible for them to teach by just following these lesson plans without having to check whether they are covering the content stipulated in the CT. Furthermore, they did not want to duplicate the work by using both the CT and the “1+9” lesson plans. As attested to by teachers at KWABA:
In 2015 we used to attend ‘1+9’ workshops and, in those workshops, we were given lesson plans that were telling us what to do on a particular day. It told us that, on this particular day, do these examples, give these activities. So I had a challenge in figuring out whether I must use the tracker or these lesson plans as I had two things and I wasn’t sure which one to use. Then I decided to use ‘1+9’ because the lessons are already planned.
Similar sentiments were echoed by the teacher at EMO during the SR-2015 survey and the 2017 interview: that teachers of Grades 8 and 9 preferred to use the “1+9” lesson plans and the Sasol Inzalo workbooks. However, since the Sasol Inzalo workbooks were not provided for learners, the teachers explained that they only used activities in the Platinum Mathematics textbook. Although this teacher claimed to use activities from the DBE workbook, there was no evidence to support his statement, since no learner workbooks were made available and the work done in the learners’ exercise books was minimal.
As pointed out by Carless (1997), an innovation associated with major reorganisation or new practices is less likely to be taken on than one which is planned according to the teachers’ needs in a manner that does not disrupt existing practices further. In this case, it seems that teachers were finding the different materials to be conflicting instead of complementing each other. As a result, they tended to use their own professional knowledge to choose between options. Those who chose the “1+9” lessons plans did so because this addressed their need for lesson planning, or because they were already familiar with the ATP and were reluctant to disrupt their existing practices.
What is noticeable also is that some of these challenges were common both to teachers who reported routine usage and those who reported none or minimal usage. The above findings imply that, while all schools might have similar challenges with implementing new interventions, it is the individual who decides how to address the challenge and whether it becomes a stumbling block or a learning curve.
Tracker reflections are time-consuming
Other than not using the CT to track curriculum coverage, it was further evident that teachers were not using it to reflect on the successes and failures of each lesson. This was verified during the interview sessions in August 2017. We found that trackers that were presented to the researchers for verification did not have the section on reflections filled in, or reflections done did not show engagement with classroom issues. One teacher said:
Usually I do not write reflections kuba into engiyicabanga mina [it’s what I think about]. I know it’s important to write down my reflections but there is no time to do it.
When probed further about what their professional conversations with HoDs entailed, it was evident that, in many cases, such conversations do not take place. The teachers at KWABA and EMO pointed out that they held monthly meetings as a department discussing general matters however, in the absence of a HoD, this was not discussed further. It was only at EKU that a HoD provided a schedule of one-on-one conversation meetings beyond monthly meetings. At this school, the reflections sections were filled in which suggests that professional conversations were taking place, at least to some degree.
Another teacher pointed out that they write their reflections on lesson plans, meaning that there is no need for them to duplicate the reflection exercise in the CT. However, when asked to show evidence of where reflections were done on lesson plans, the teacher could not provide it. Yet another teacher commented that reflections were a waste of time. He felt that the KZNDoE does not understand the difficult conditions under which they teach which is why they were expected to do so much paper work: “I think the department has lost track of what is happening at grass root level.” This teacher further indicated that he felt that reflections do not allow them to raise their honest opinions: “What you did and what you enjoy and what you will do better next time is nonsense. We never enjoy anything, we are struggling to get concepts across to learners.”
These comments suggest that many teachers did not feel that the reflection exercise was useful to them, especially given the inadequate training on reflections. This points to the fact that, without adequate training and suitable support, it is difficult for teachers to implement a new intervention such as this. As Carless (1997) points out, teachers’ perceptions of the practicality of an innovation play a major role in its usage. The above findings regarding the lack of written reflections by teachers mean that teachers will not have personal records of areas needing remedial attention. While one cannot say that teachers are not reflecting at all, the lack of evidence in most CTs that we reviewed suggests that conversations between teachers and HoDs to address problems of coverage are not aligning with the Jika iMfundo guidelines.
The limited attention to written reflections that was evident among these schools is a concern, since many research studies have identified the important role of reflections in any teacher professional development programme (Bansilal & Rosenberg, 2011; Brookfield, 1995) and reflections form part of the Jika iMfundo intervention. Without individual and joint reflections, the professional conversations around which Jika iMfundo is planned are meaningless. Although it is possible to reflect very deeply without writing this down, written reflections can enhance meaningful professional conversations between colleagues. This was confirmed by the HoD at EKU who pointed out that, since teachers are writing down reflections, he was now able to make connections between the indicated content covered in the CT and what was in the learners’ books, thus confirming that written reflections do provide records about how lessons or activities could be improved the next time around. It would therefore be valuable for further research to investigate how authentic and meaningful reflections could be encouraged.
Lack of skill and knowledge of utilisation of tracker
Seven teachers pointed out that the reason they did not use the CT was that they were not properly introduced to it or given training on how to use it. In many instances, HoDs just handed them the trackers to use, without training them. One of these teachers said that, when he arrived at the school, he was given a textbook only and that the DBE workbook he received later was a result of his insistence on getting it. Since he had never heard of the CT before, he did not ask for it. This suggests that the train-the-trainer system is not effective enough in assisting teachers and HoDs to take ownership of the tool. This lack of support from HoDs or senior teachers is reflected in an interview response by a novice teacher at ZWELI who said: “La ikwamazibonele”, meaning “Here you fend for yourself with no assistance at all.” Even though this type of response was more prevalent during the 2015 survey (SR-2015), it also surfaced during the interviews in August 2017, suggesting that this challenge was still an ongoing problem. In addition to teachers not being able to use the CT effectively, issues of teacher transfers, resignations or the appointment of new teachers or HoDs during the course of the year, were also identified as problematic. It was evident from these seven schools that most of the new teachers in these schools had no knowledge of the CT and had no one to assist them, often because the trained teachers and HoDs had left in the middle of the year.
Shortage of resources
Many teachers cited the shortage of resources as one of the reasons for not using the CT maximally. Teachers pointed out that, since there was a shortage of textbooks for learners and they did not have resources such as photocopying machines, it was difficult to refer learners to various activities – so they chose to write a few questions for learners to do on the board. While resources might be seen as playing a small part in the learning process, as reported by the World Bank report (2017), in this case, what is highlighted is the challenges of implementing changes in an under-resourced or poorly managed system. Effective management of resources entails making sure that there are processes in place to maintain and fix machines timeously and that resources, such as textbooks, are returned from previous users and available for new users each year. When these processes are not in place, teachers then have to resort to using less effective teaching methods.
Enabling factors for using the CT
Having set out participants’ views of the challenges hindering their tracker use, we now turn to consider the enabling factors that enhanced their tracker use. Overall, we found that, although teachers and HoDs did not seem to use the CT for the purposes for which it is intended and all identified challenges with using it, participants nonetheless drew benefits from having it to hand. All of the participants identified at least one enabling factor related to the use of the CT, while participants in ten schools identified more than three enabling factors. While these findings do not overshadow the challenges identified, they do show that not all teachers and HoDs have rejected the tool. With more support provided, it may well be that more schools would be willing to adopt the CT fully.
The major enabling factors mentioned related, as with hindering factors, to features of the tracker itself, to teacher knowledge and attitudes towards the intervention and to conditions in schools more broadly. These are set out below.
The Tracker is detailed and easy to use
Of the 14 teachers interviewed, eight commented on the fact that the tracker is easy to use, especially for checking the topic to be covered and the extent to which that topic should be covered. Furthermore, teachers pointed out that the CT helps them with planning, as confirmed by the extract from the PILO Survey AS-2016 shown in Figure 8.2. These teachers also indicated that the CT is more specific than the ATP in terms of showing how much depth is required for each topic.

Extract from the AS-2016
Figure 8.2 Extract from the AS-2016
While it was evident that the majority of teachers were not using the CT effectively, four teachers highlighted that, since the CT is CAPS-aligned and topics are broken down, this helped them with unpacking the content to be taught, thus helping with lesson planning and time-frames. Three teachers pointed out that the tracking of all textbooks made it easy for them to know where to find additional resources. A teacher at EMO said: “Although I do not get enough time to give learners more activities but I know now when the work given to learners is enough or not.”
While teachers complained about the inflexibility of the tracker with regard to manoeuvring the sequencing, two teachers found the CT to be sufficiently flexible since it provided consolidation times, allowing teachers to address any shortfall they may have with curriculum coverage. Nine teachers found the CT useful since it gave them direction, as well as alerting them when they fell behind with the content to be covered. This was echoed by a teacher at UMZI:
although it makes me guilty and I chose not to use it but the reality is that I am aware that I am behind with content to be covered because the tracker gives clear time frames.
Tracker provides assessment tasks
One of the benefits of the CT identified by teachers was that the assessment tasks in the tracker helped with setting papers of appropriate standard, as evidenced in the learners’ assessment books. In the words of a teacher at EMO:
I-tracker iyangisiza kakhulu nje ngama-Investigations because for some you akubi lula ukucabanga i-Investigation e-right for learners [tracker helps me a lot with investigations because sometimes it is not easy to find a suitable investigation for learners].
Another teacher from KWABA stated that the assessment tasks in the tracker are useful even for revision purposes. Such comments showed that teachers are using the CT as a resource beyond just tracking curriculum coverage.
Five teachers who reported routine usage of the CT and provided evidence pointed out that since the CT tracks different sources, this made it easy for them to find suitable activities and supplementary activities. These were also the schools that performed better than the other schools in the ANA in both 2013 and 2014. As pointed out by Stols (2013), schools that give learners more practice examples perform better. These findings seem to be similar – that schools with higher rates of curriculum coverage (e.g. GLEV, TISA) were using the tracker as a useful resource when searching for suitable learner activities and assessments.
School organisational support
Drawing together these arguments, it seems that in schools with functioning systems where everyone is accountable to play their role, interventions can be implemented even in the face of challenges. In the PILO surveys and our interviews, seven teachers raised the point that they struggled with using the CT because they were not properly trained and/or not supported by the HoDs. This is illustrated by the case mentioned earlier of the teacher who was not told about the CT when he arrived at the school and was given only textbooks to use. This illustrates how school organisation may impede CT use by not ensuring continuity between teachers and cohesion within subject departments. At this school, it seems there was no accountability on the part of the school management to ensure that the new teacher received guidance and support from an experienced teacher, showing that the continuity function was not seen as important. At the same time, at schools like GLEV, JOHR and TISA, it was clearly noticeable during our interview sessions that systems and processes were in place and worked well. It was also at these better functioning schools that the CT was used routinely. The comment in Figure 8.3 by a PILO coach who visited GLEV emphasises the point that, in a well-functioning school, the Principal and the staff work together in systems which support the work of teaching and learning, where a “structured division of labour distributes functions and integrates curriculum delivery across the classroom, the school and the home” (Taylor, 2011, p. 4).
| What a refreshing conversation with this staff. It was made very clear by the school that we need to adopt the pilot project because we are trying to address the imbalances of the past. The school has adopted the JIKA IMFUNDO slogan because what we all do matters as the nation is counting on us to change education around. This is a journey and we are walking it every day no matter how slow. It was good to see a parent in the school trying to work hard in hand with the educators to help the learner as they had seen that she is slipping – because a majority of the parents believe that if I send my child to a good school, their grades will automatically be good, but we need to work together. |
Comment by PILO COACH in the AS-2016
Figure 8.3 Comment by PILO COACH in the AS-2016
Notwithstanding other factors, it seems that a supportive environment and accountability by all stakeholders are necessary conditions that need to be in place in schools for the proper implementation of Jika iMfundo. Furthermore, it is also necessary that teachers, as the main implementers of the CT tool, have taken ownership of the tool.
Extent to which the CT influences curriculum coverage
Having addressed our first research question on participants’ use of the CT and the factors they perceived to be hindering and/or enabling this, we now turn to our second question: to explore the relationship between CT use and curriculum coverage. How, if at all, has the introduction of the CT influenced the rate of curriculum coverage?
Correlation between CT and curriculum coverage
Even though we cannot say there is causation between the usage of the CT and curriculum coverage, our findings do show some correlation, because the few schools that used the CT routinely seemed to be on track with curriculum coverage. This suggests that usage of the CT is assisting these schools, to some extent, with curriculum coverage. Although there are limits to this claim since only a few schools have shown this trend, we can further argue that schools, which have shown minimal or inconsistent usage of the CT, also showed minimal coverage of the curriculum.
For example, at ZWELI and EKU, where usage of the CT was minimal, the schools only covered just above 50% of the work that needed to be covered. During interviews, when asked whether they have noticed any improvement in the learner pass rate, one teacher said:
Although I cannot say there is a drastic change but yes, I can say there is. Although improvement from perhaps 12% to 15% cannot be seen as much, but it is an improvement.
Across most schools, it was quite evident that, despite what teachers said about using the CT, the amount of curriculum coverage, especially at Grade 9, was minimal. This trend of low curriculum coverage has been identified in many studies (Bansilal et al., 2016; Stols, 2013; Taylor, 2011) and our study confirms that it is still prevalent amongst most schools in our sample. Stols (2013) argues that fewer days spent on mathematics topics translates into fewer classroom activities for practice purposes resulting in poor performance. Similarly, when learners have done a variety of exercises covering many topics, this indicates that the curriculum is covered and thus increases their chances of performing better, as revealed by Taylor (2011).
Although we cannot show a direct influence of the increased curriculum coverage on improved ANA results, what is evident is that the three schools that provided evidence of curriculum coverage and of a sufficient number of practice activities in the learners’ books, also have higher averages in the ANA results, thus confirming a positive correlation between curriculum coverage and learner performance.
Inaccurate reporting of coverage
The PILO surveys for the 14 schools in the sample indicated that teachers and HoDs in ten schools were on track with curriculum coverage. However, four schools did not provide any classroom material to show the extent of the curriculum coverage. Only three schools provided evidence from the learners’ books confirming the extent to which they have covered the curriculum and, for these schools, the evidence provided does not necessarily support their claims. An extract from the PILO coach shown in Figure 8.4 raises doubts about coverage claims.

Response from SR-2016
Figure 8.4 Response from SR-2016
Evidence from the number of activities in the learners’ books at ISIZ confirms that the curriculum was not completed. Table 8.5 shows the number of activities done by learners out of a possible 24 activities in the book. To confirm that learners were doing less than what was expected, the comment by the PILO coach revealed that the only activities captured were from the textbook, since there was no evidence of DBE workbooks to check.
| Number of activities done by learners (total possible: 24) | |
|---|---|
| Total number of exercises/activities learner 1 | 5 |
| Total number of exercises/activities learner 2 | 7 |
| Total number of exercises/activities learner 3 | 7 |
Extract from AS-2016: Number of activities done by learners out of a possible 24
Table 8.5 Extract from AS-2016: Number of activities done by learners out of a possible 24
During the August 2017 interviews in another school, the teacher admitted that he only used activities from the textbook and had not given learners DBE workbooks. The DBE workbooks were kept in the Principal’s office, still sealed in their original packing (Figure 8.5).
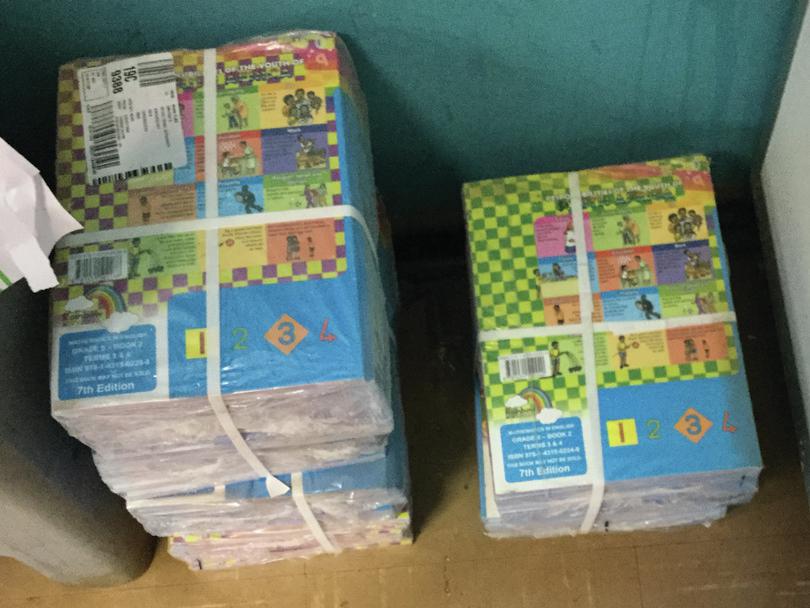
DBE workbooks in their original packaging, found in a Principal’s office
Figure 8.5 DBE workbooks in their original packaging, found in a Principal’s office
Uneven coverage of work across the terms
The general trend that was observed in the data that emerged from the interviews was that at least 50% of term 2 work in the General Education and Training (GET) phase was covered – which means, in effect, that coverage was incomplete. As a result, at the start of term 3, teachers were still completing the previous term’s work which implies that, by the end of the year, the curriculum would have not been covered. Table 8.6 shows the minimal number of activities/exercises covered in one school, MGI, for term 2 of 2017.
| Written exercises | ||||||||||
|---|---|---|---|---|---|---|---|---|---|---|
| Learners | Week 1 18/4–21/4 |
Week 2 24/4–26/4 |
Week 3 2/5–5/5 |
Week 4 8/5–12/5 |
Week 5 15/5–19/5 |
Week 6 22/5–26/5 |
Week 7 29/5–2/6 |
Week 8 5/6–9/6 |
Week 9 12/6–15/6 |
Total |
| Learner 1 | 1 | 0 | 2 | 2 | 1 | 4 | 3 | 2 | 1 | 16 |
| Learner 2 | 1 | 0 | 2 | 2 | 1 | 4 | 3 | 2 | 1 | 16 |
Extract from MGI Interview in 2017
Table 8.6 Extract from MGI Interview in 2017
Although the minimal usage of the CT was across phases, the minimal amount of work done in the learners’ books for a whole term seems to be more dominant in the GET phase compared to the Further Education and Training (FET) phase. Teachers and HoDs said that the main reasons for this were the compulsory extra classes for the FET phase and the fact that learners write common papers that push teachers to cover the expected work. One teacher at EMO said:
… because we have common papers at the FET it is a must that we must finish the syllabus while in Grade 9 I can set the exam on what I have managed to cover.
A comment from a HoD at MGI revealed the following:
Grade 12 teachers do cover 100% of the curriculum due to the pressure from the DBE, but in Grade 10 and 11, completion of the curriculum is still not properly done.
The above comments raise serious concerns. Firstly, the lack of common standard papers at the GET phase results in teachers and HoDs becoming complacent about not covering the curriculum. Secondly, while it is necessary that focus is given to Grade 12, it is also important that the teaching and learning process in all grades should receive more stringent attention.
Too much content to be covered
Nine teachers from the GET and FET phases highlighted content overload as one of the reasons they were unable to complete the curriculum on time. Again, the blurring between the CT and CAPS was evident. Teachers complained that the content tracked in the CT (based on CAPS) is for an ideal learner while, in reality, most learners are two grades behind their actual grades. This was echoed by one teacher during the August 2016 survey (Figure 8.6).

Response from AS-2016
Figure 8.6 Response from AS-2016
The same comment was raised during the August Interview of 2017 by one of the teachers:
The work tracked for 60 minutes with my learners, sometimes it takes me two to three days to cover, therefore I am automatically behind the work schedule and it’s not my own doing.
Similar sentiments were echoed by a HoD that extra classes at the FET level should be used for remedial work but, instead, teachers were using them to cover the curriculum, thus confirming that teachers felt that there is too much content prescribed within a limited time. These comments raise a serious issue because, if teachers experience CAPS curriculum overload, then the CT may not assist them, since it is tracking CAPS. As a result, teachers may well shift the blame to the CT, as evident in the challenges mentioned above.
Shortage of learner teacher support material (LTSM) and overcrowding
Many participants highlighted the shortage of LTSM as a reason for poor curriculum coverage. Of the 14 schools, eight teachers commented that the shortage of books made it difficult to give learners homework and therefore all the work was mostly done as classwork, causing them to fall behind in the prescribed work. Other teachers complained about shortages of other resources, like calculators, as one of the reasons. This concern was also raised in the AS-2016 survey (Figure 8.7).

Response from AS-2016
Figure 8.7 Response from AS-2016
The shortage of resources was further articulated by one of the teachers during the interviews in 2017. This teacher pointed out that, when learners do not have calculators, even one simple calculation takes them a long time to do because they keep exchanging calculators:
If, as a teacher, you continue before they have discovered the answer, they get confused and so I have to wait for them.
The issue of the shortage of resources might be a real challenge because, when learners do not have textbooks, it will be difficult to do the activities. As one teacher pointed out:
It’s good now that the CT is tracking Inzalo workbooks but we do not have Inzalo workbooks for learners, so I cannot give them the activities from Inzalo workbooks.
The above comments highlight the fact that there are many factors beyond the control of the individual teacher that impede the success of any curriculum innovation. Hence, these situational factors need to be addressed in order for teachers to be able to cover the curriculum.
Over and above the issue of the shortage of LTSM, teachers raised the issue of class overcrowding as an impediment to curriculum coverage, linking this to the shortage of LTSM. Having too many learners in the class with a shortage of books and other desired resources made it difficult to proceed effectively with the lesson, since many learners could not follow what was being taught and this made it difficult for the teacher to continue with a lesson effectively. An extract from EKU emphasises the concern teachers had with the shortage of LTSM and overcrowding (Figure 8.8).
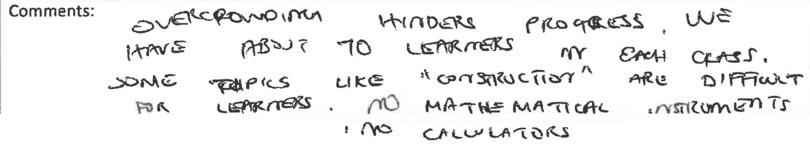
Response from AS-2016
Figure 8.8 Response from AS-2016
Many of the challenges participants raised in relation to curriculum coverage and CT use are systems problems which negatively impact on the proper implementation of Jika iMfundo. It appears that, even though the CT provides direction and refers teachers to various activities from other resources, without these resources it is difficult for teachers to use the CT for the purpose for which it was intended.
Lack of learner commitment to school work
In this school learners do not bother with doing homework. Then it means I have to always go over homework with them before I start a lesson and it takes away time prescribed for that particular lesson (comment by a teacher from EMO).
This issue of learners not doing homework was also evident in both of the PILO surveys conducted in 2016. Another concern associated with learners’ lack of commitment that impacted on curriculum coverage was the high rate of absenteeism. Some teachers commented that the rate of absenteeism was affecting curriculum coverage because, when more learners were absent, teachers found themselves having to repeat the content taught on those days.
Internal school issues and DBE commitments
Almost all teachers complained about departmental workshops that they were expected to attend which then impacted on curriculum coverage. In the SR-2015 survey, one teacher commented that, as the facilitator of “1+9”, every Wednesday he needed to be away from school to first plan for the facilitation of the “1+9” workshop and then, on Mondays, he needed to facilitate that workshop. This meant that he was at school for only three days a week. Below is an extract from a coach during the AS-2016 survey confirming the teacher’s claim and how this commitment had affected his lack of curriculum coverage (Figure 8.9).

Response from AS-2016
Figure 8.9 Response from AS-2016
In addition to the Department of Education commitment, teachers are expected to attend the Jika iMfundo workshops. One teacher commented:
Look, you came here for an interview and you saw for yourself that, when you came, the subject advisor was here keeping us away from classes from morning till 12 pm and from 12 pm now I am having this interview. Today I have not taught these learners, so automatically I am behind and it’s because of the Department, but it is me who is expected to make a plan to cover the work.
This comment clearly shows teachers’ frustrations with disruptions to their work consequently making it harder to maintain curriculum coverage.
Another point raised by a HoD was that, when teachers resigned or were transferred to other schools, the Department did not replace them immediately. When there was no teacher, there was no teaching taking place and, as a result, the curriculum was not covered. In the August 2016 survey, another teacher raised the issue of internal school problems, such as the shortage of water which forced the school to close early, thus disrupting teaching for the day. The Grade 12 examinations in term 4 were another internal school issue raised by teachers that affected curriculum coverage. Teachers in the GET phase are expected to invigilate the Grade 12 exams and, at times, the furniture in their GET classes is used for these examinations, thus forcing them to start the GET exams early so as to accommodate the Grade 12 learners. As a result, they could not cover the curriculum as expected.
Suggestions by teachers to address curriculum coverage
One suggestion made by GET teachers to address curriculum coverage was that the Grade 12 intervention programmes should be filtered down to lower grades. Four teachers pointed out that, since they teach across all phases, they cannot have extra classes for every grade. Implementing intervention programmes lower down in the school would help learners understand mathematics at senior level. Another suggestion was that Subject Advisers should be more supportive, especially at the GET level. Teachers felt that Subject Advisers were not hands-on, especially in assisting them with regard to curriculum coverage.
Conclusion
Our study of CT usage by secondary mathematics teachers and HoDs confirms that mathematics curriculum coverage continues to be problematically low in KZN schools. Our research also confirms that the majority of teachers and HoDs in our sample of schools were not using the Jika iMfundo planners and trackers as intended to assist with curriculum coverage.
A major issue of concern for us as researchers is the disjuncture we found between teachers’ self-reporting of CT usage and curriculum coverage and the evidence provided by the learners’ books which did not always match what teachers reported they had covered. Also of concern is evidence of inaccurate teacher completion of trackers, endorsed by their HoDs, to meet reporting compliance requirements. This suggests the importance of moving beyond self-reporting to gain more reliable evidence about the implementation of Jika iMfundo in schools.
In exploring what teachers and HoDs perceived to be impediments to their usage of the CT, we found clearly articulated difficulties related to several themes: features of the tracker itself; teacher knowledge and attitudes towards the intervention; organisational conditions within schools; and broader socio-economic contextual issues. What emerged clearly is that most of the teachers and HoDs could identify problems of content overload and fast pacing with the CAPS curriculum and the Jika iMfundo planner and tracker could not assist in remedying these problems. While the CT could highlight coverage problems, it could not solve them. If anything, the CT was identified with CAPS and was folded into teachers’ broader frustrations with CAPS. This suggests that there may be limits to what the CT is able to achieve if indeed problems are due to CAPS itself and to conditions in classrooms such as having to teach learners with different levels of understanding in the same class, often summed up as “slow learners”. If teachers perceive that the CT limits their flexibility to deal with problems of coverage and pacing, or limits their professional choices, this may well impact upon their willingness to use the CT as intended.
That said, our research shows that most teachers did find at least some benefit from having the CT available to them. Teachers appear to use the CT as a resource for a number of reasons: it provides a convenient tracking tool even if it is not used in planning; it gives additional guidance to teachers on the required curriculum depth; and it points to additional resources including assessments. Thus, we suggest that there is potential for teachers to take greater ownership of the CT if they have the opportunity for more thorough engagement with its possibilities for usage and if the CT were to be adjusted in the light of problems identified, particularly in relation to the requirements of CAPS and the ATP.
Our research suggests that the reflection component of the CT also needs further attention. The continuing challenges teachers expressed with curriculum coverage and the lack of written reflections by teachers might be an indication that HoDs are not using the HoD tools to track curriculum coverage and to conduct professional conversations with teachers. It is from the reflections that HoDs can get a better understanding of the challenges experienced by teachers so that they can discuss how they could address the issues they face. However, if a HoD does not use the teachers’ written reflections as a meaningful basis for professional conversations and future planning, then teachers are not likely to see the need to engage in the time-consuming reflective activities.
An important finding of our research is confirmation of the positive correlation between curriculum coverage and learner performance, as highlighted by other studies mentioned in our literature review. Though very few schools in our study used the CT routinely, those that did seemed to be on track with curriculum coverage, while those with minimal or inconsistent usage of the CT also showed minimal coverage of the curriculum. Though the schools in our study generally showed low levels of curriculum coverage, our study confirms that coverage is an important focal point for improvement. This confirms the KZNDoE’s concern to develop an effective strategy for monitoring curriculum delivery and its partnership with PILO to support curriculum coverage through the Jika iMfundo intervention.
That said, the above findings confirm the issues we set out to explore: that the Jika iMfundo model has not yet been implemented as envisaged by secondary mathematics teachers and HoDs over the period of three years and curriculum coverage of secondary mathematics is generally poor. Our study suggests that a supportive organisational environment and accountability by all stakeholders are necessary conditions for the successful implementation of Jika iMfundo. As noted in the NEEDU report (2017), schools that do well are those that carry out the ordinary functions properly. It is imperative that HoDs and lead teachers, who have been trained on the utilisation of the Jika iMfundo tools, should be regularly supported by the districts to ensure that all teachers, old and newly employed (novice) teachers, are adequately trained on the value and effective use of the CT.
Many of the challenges of curriculum coverage identified by teachers and HoDs are systems related and these affect the implementation of Jika iMfundo. In our study, teachers identified numerous disruptions caused by factors such as attending too many meetings, monitoring visits by projects, learner and teacher absenteeism, as well as reorganisation of the school for the Grade 12 exams. It is clear that teaching time should be prioritised and teaching disruptions should be minimised as much as possible by all stakeholders. Teachers also identified problems with shortages of LTSM and the challenges of curriculum coverage in an under-resourced or poorly managed system. The effects of poverty and general socio-economic problems provide contextual difficulties for most of the schools in our study.
There is a need for seamless synergy between the Jika iMfundo programme and the KZNDoE. If all Subject Advisers could adopt Jika iMfundo, participate in the training sessions, distribute the same teaching and learning tools to mathematics teachers and HoDs, encourage the use of the CT and speak the same language as Jika iMfundo, then some of the confusion around expectations and requirements on teaching, learning and assessment may be alleviated. However, this still leaves the challenge of addressing system-level problems that lie beyond Jika iMfundo itself.
References
- Bansilal, S. (2017). The difficulty level of a national assessment of Grade 9 mathematics: The case of five schools. South African Journal of Childhood Education 7(1), a412. https://doi.org/10.4102/sajce.v7i1.412
- Bansilal, S., & Rosenberg, T. (2011). South African rural teachers’ reflections on their problems of practice: Taking modest steps in professional development. Mathematics Education Research Journal, 23(2), 107–127.
Bansilal, S., Zondi, L., & Shabalala, L. (2016). Investigating Opportunities to learn: An analysis of Grade 9 Mathematics learner notebooks. Paper presented at the 22nd Annual National Congress of the Association for Mathematics Education of South Africa (AMESA), 29 June–3 July, Nelspruit. - Bhengu, T. T., & Mkhize, B. N. (2013). Principals’ instructional leadership practices in improving learner achievement: Case studies of five secondary schools in the Umbumbulu area. Education as Change, 17, Suppl 1, S33.
- Brookfield, S. D. (1995). Becoming a critically reflective teacher. San Francisco, CA: Jossey-Bass.
- Brown, M. (2009). The teacher-tool relationship: Theorizing the design and use of curriculum materials. In J. T. Remillard, B. Herbel-Eisenmann, & G. Lloyd (Eds.), Mathematics teachers at work: Connecting curriculum materials and classroom instruction. New York: Routledge, pp. 17–36.
- Carless, D. R. (1997). Managing systematic curriculum change: A critical analysis of Hong Kong’s Target-Oriented Curriculum Initiative. International Review of Education, 43(4), 349–366.
- Charalambous, C. Y., & Hill, H. C. (2012). Teacher knowledge, curriculum materials and quality of instruction: Unpacking a complex relationship.Journal of Curriculum Studies, 44(4), 443–466.
- Cohen, L., Manion, L., & Morrison, K. (2011). Research MetHODs in Education (7th ed.). New York: Routledge.
- Creswell, J. W. (2009). Mapping the field of mixed methods research. Journal of Mixed Method Research, 3(2), 95–108.
- Davis, E. A., & Krajcik, J. S. (2005). Designing educative curriculum materials to promote teacher learning.Educational Researcher, 34(3), 3–14.
- Department of Basic Education. (2014). Report on the Annual National Assessment of 2014: Grade 1 to 6 & 9. Pretoria: Government Printer.
- Department of Basic Education. (2016). National Senior Certificate 2016 Diagnostic Report. Pretoria: Government Printer.
- Elmore, R. (2004). School reform from the inside out. Cambridge, MA: Harvard University Press.
- Elmore, R. (2008). Leadership as the practice of improvement. In B. Pont, D. Nusche, & D. Hopkins (Eds.), Improving school leadership, Vol. 2: Case studies on system leadership. Paris: OECD, pp. 37–67.
- Grace, S., Higgs, J., & Horsfall, D. (2009). Writing qualitative research in practice. Sydney: Sense Publishers.
- Graven, M. (2016). When systemic interventions get in the way of localized mathematics reform. For the Learning of Mathematics, 36(1), 8–13.
- Jones, M. T., & Eick, C. J. (2007). Providing bottom-up support to middle school science teachers’ reform efforts in using inquiry-based kits.Journal of Science Teacher Education, 18(6), 913–934.
- KwaZulu-Natal Department of Education. (2012). Curriculum Management and Delivery Strategy. Retrieved from: http://www.kzneducation.gov.za/Portals/0/curriculum/Curriculum%20Management%20Strategy.pdf
- Miles, M. B., & Huberman, A. M. (1994). Qualitative Data Analysis (2nd ed.). Thousand Oaks, CA: Sage Publications.
- Mji, A., & Makgato, M. (2006). Factors associated with high school learners’ poor performance: A spotlight on mathematics and physical science. South African Journal of Education, 26(2), 253–266.
- National Education Evaluation and Development Unit. (2017). Systemic Evaluation of Basic Education Systems: Schools that Work 11 – Lessons from the Ground. Pretoria: Government Printer.
- Pournara, C., Mpofu, S., & Sanders, Y. (2015). The Grade 9 Maths ANA – What can we see after three years? Learning and Teaching Mathematics, 18, 34–41.
- Reeves, C., & Muller, J. (2005). Picking up the pace: Variation in the structure and organisation of teaching school mathematics. Journal of Education, 37(1), 103–130.
- Stols, G. (2013). An investigation into the opportunity to learn that is available to Grade 12 mathematics learners. South African Journal of Education, 3 3(1), 1–18. Retrieved from: http://www.sajournalofeducation.co.za
- Taylor, N. (2011). The National School Effectiveness Study: Summary for the synthesis report. Johannesburg: JET.
- World Bank. (2017). World Development Report 2018: Learning to Realize Education’s Promise. Washington, DC: World Bank. doi: 10.1596/978-1-4648-1096-1.
- Zangori, L., Forbes, C. T., & Biggers, M. (2013). Fostering student sense making in elementary science learning environments: Elementary teachers’ use of science curriculum materials to promote explanation construction. Journal of Research in Science Teaching, 50(8), 989–1017.